-
09/22/2013 Mousetrap
Sector Model XLU & XLK 1.54%
Style Model Small Value
Large Portfolio Date Return Days
ABX 4/11/2013 -22.91% 163
TTM 5/6/2013 1.17% 138
OKE 6/17/2013 20.67% 96
BTI 7/1/2013 5.84% 82
CLH 7/8/2013 10.47% 75
FAST 7/22/2013 7.73% 61
VAR 8/2/2013 3.96% 50
OUTR 8/19/2013 -25.95% 33
QCOM 9/3/2013 4.19% 18
FLR 9/16/2013 7.14% 5
(Since 5/31/2011)
S&P Annualized 10.94%
Sector Model Annualized 23.11%
Large Portfolio Annualized 28.53%
From: http://market-mousetrap.blogspot.com...arket-but.html
Rotation: selling FAST; buying CXW.
Rather bizarre rotation selling a building supply company and buying a REIT. No clue what that means, but Ill follow the model. CXW has basically gone nowhere in forever. If were headed toward some kind of market decline, that may not be such a bad thing
No market comment today, though. Too many external variables to get any meaningful read on market internals.
Taper, no taper, shut down, no shut down, war, no war. Eh. Cant control it. What I CAN control is the methodology of my model. The data is continuing to mature, and the model is definitely developing into two sets: one for an IRA account and one for a Taxable account:
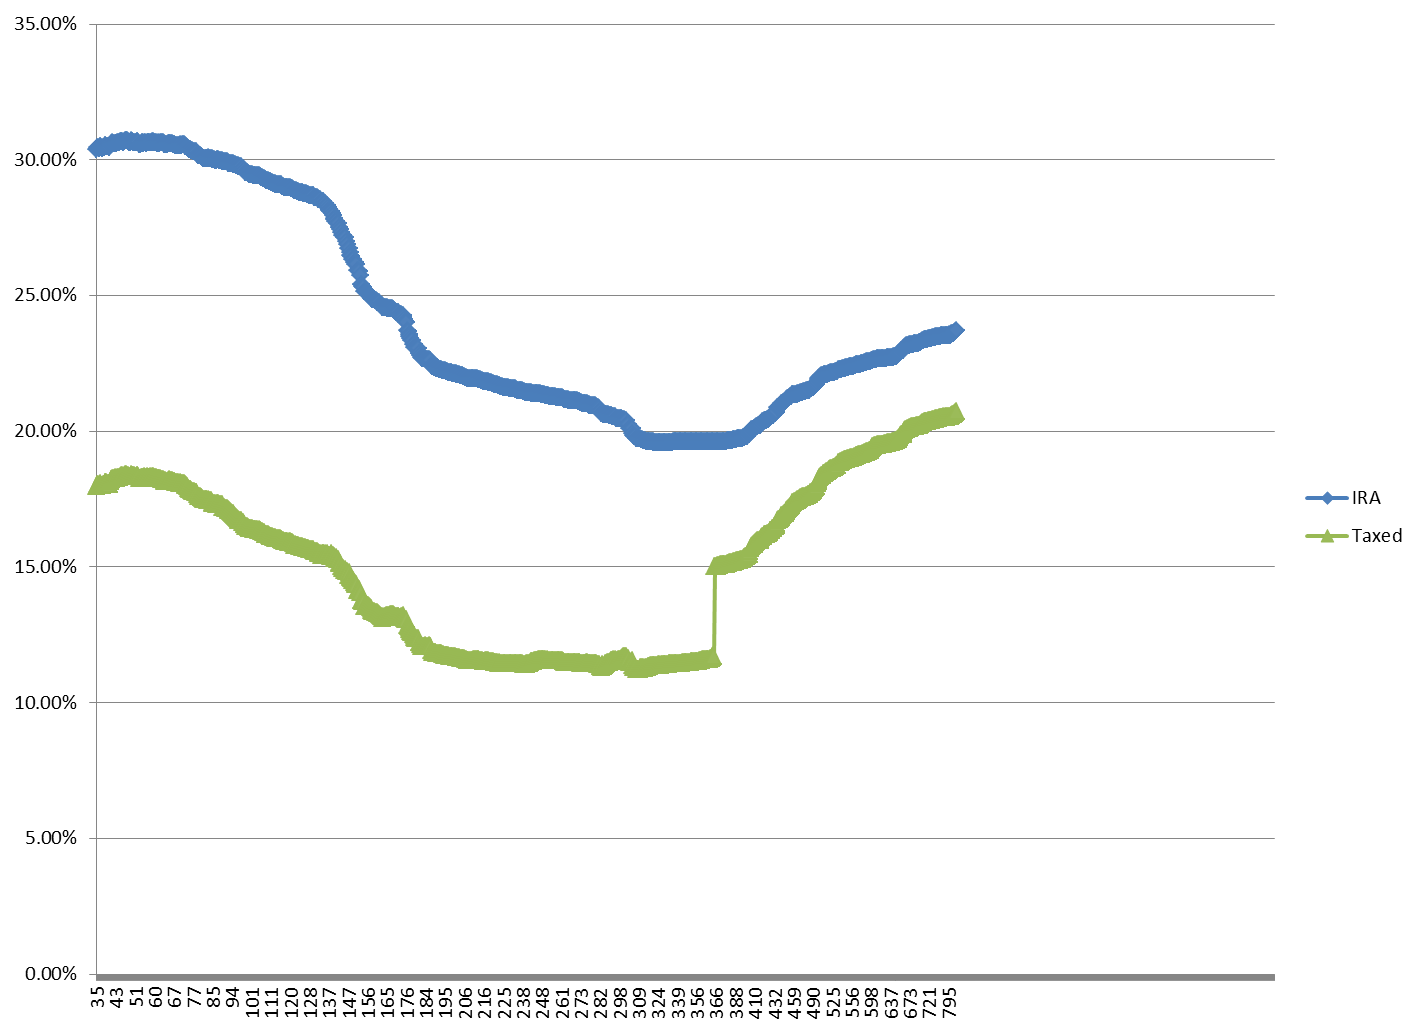
A taxable account clearly performs better for longer term holding periods, but I do not yet have a rotation point. Im quite intrigued by the resilience of the selections well past two years from their original trade. The spike at one year, of course, is the difference between long and short term capital gains taxes.
Lesson for now: track your trades when you open them, when you close them
and AFTER you close them to see how they would have done on a longer hold. You might discover something useful, as I am here.
Tim
-
Reset
Sector Model XLU & XLK 2.33%
Style Model Small Value
Large Portfolio Date Return Days
ABX 4/11/2013 -23.99% 166
TTM 5/6/2013 1.21% 141
OKE 6/17/2013 21.65% 99
BTI 7/1/2013 5.83% 85
CLH 7/8/2013 10.22% 78
FAST 7/22/2013 6.94% 64
VAR 8/2/2013 4.19% 53
OUTR 8/19/2013 -23.61% 36
QCOM 9/3/2013 4.07% 21
FLR 9/16/2013 5.52% 8
(Since 5/31/2011)
S&P Annualized 10.67%
Sector Model Annualized 23.31%
Large Portfolio Annualized 28.39%
From: http://market-mousetrap.blogspot.com...uying-gco.html
Rotation: selling OKE; buying GCO.
As I noted on the blog yesterday, the negative gap in FAST prevented the scheduled rotation. After recalculating last night, FAST moved out of the sell window.
I actually like this rotation better.
Tim
 Posting Permissions
- You may not post new threads
- You may not post replies
- You may not post attachments
- You may not edit your posts
Forum Rules


 Reply With Quote