Wayne's Confusion Index
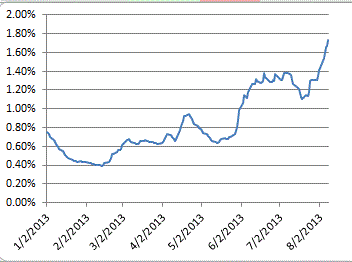
I have been watching NYSE new 52-week lows rising. The chart below shows what is called Wayne's Confusion Index developed by Wayne Whaley. This index takes the minimum value of the NYSE 52-week highs or lows and then does a 5% exponential moving average of that value. When new lows and hew highs are both high this index will climb.

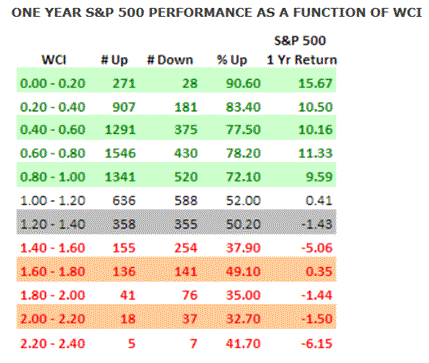
The chart below is the historical one year performance of the S&P500 based on the value of the index. You can see that we have entered a troubled regime. Current index value is 1.73% and rapidly climbing. At this level the chart shows that less than 50% of the time is the market up the following year.

This index reminds me of the Hindenburg Omen which works on the same principle: In an advancing market new highs are being made but when new lows begin climbing at the same time this implyies that part of the market is in their own private bear market. Eventually the new lows drag the market lower. We have gotten four Hindenburg Omen signals in the last 11 days. Google the term if you are unfamiliar. The makeup of the NYSE with so many ETFs and inverse ETFs may be confusing this type of analysis.
Mike Scott
Cloverdale, CA


 Reply With Quote