Please allow me a couple of newbie questions:
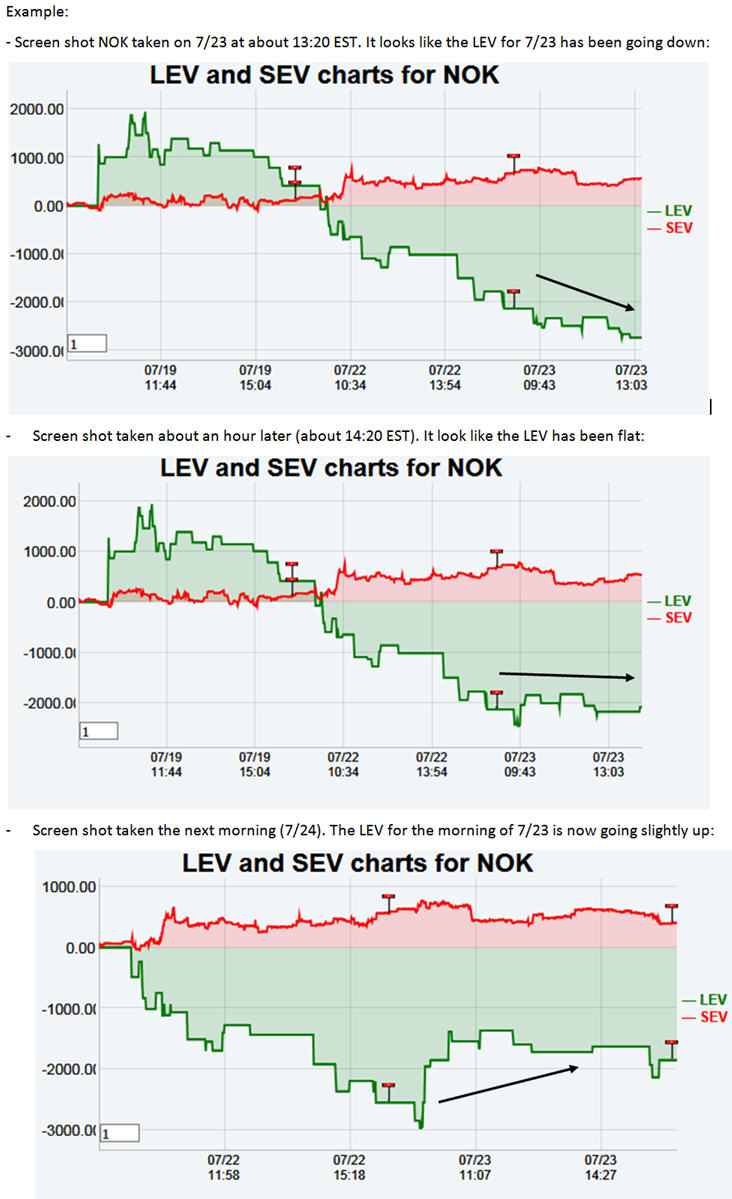
1) I noticed that the RT EV graph changes during the day. What is the reason for that? (Example attached below)
2) Does it make sense to use LEV for ADR shares, given that the main trading venue is outside the US?
Example: the US price of Nokia (NOK) seems to mostly just follow the market in Helsinki until Europe closes at 11:30 AM EST. In the US only 13% of the shares for NOK are held by institutions (
http://www.nasdaq.com/symbol/nok/ownership-summary ) .
Could the EV for just the US market give a misleading picture without the EV data for the European market?
Thanks!
Karin
Attachment 19277


 Reply With Quote


