+ Reply to Thread
Results 1 to 6 of 6

Thread: 6-13-2013 Before the Open Comments

  1. #1
    Join Date
    Dec 1969
    Location
    Tarzana, CA
    Posts
    962

    6-13-2013 Before the Open Comments

    The NASDAQ MarketSchool Exposure Model went to correction yesterday, one day after IBD placed the market in correction. We had distribution on the NASDAQ giving us a full distribution count and also closed below the 21-day ema (two market sell signals).
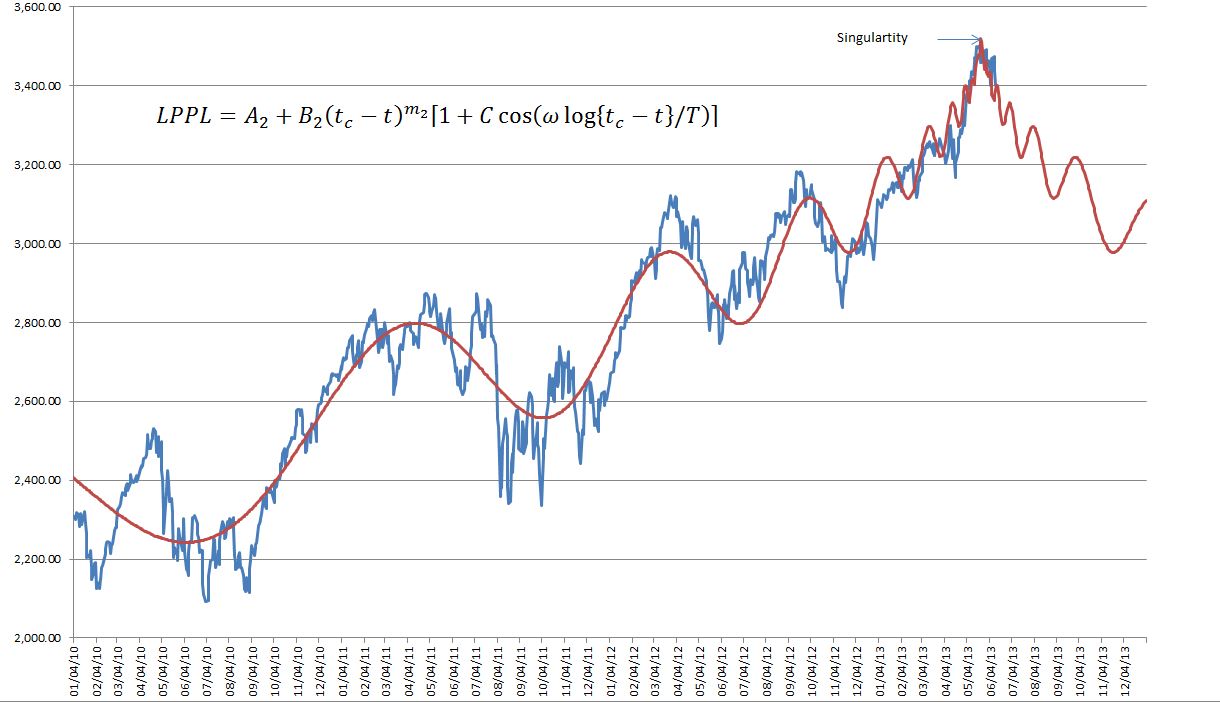
    The chart below is the updated Didier Sornette Why Markets Crash chart showing now the projected trajectory after the probable top. The singularity in the equation occurred on May 22, the actual day of the top. Didier says that the singularity is usually good for plus or minus a week or two. So this just happened to be right on. The post-singularity curve is created by reversing the tc and t terms (critical date and current date) in the equation. The interesting thing to me is that the log-periodic nature of the curve shows high frequency oscillations close to the singularity which is why possibly it is so difficult to short when close to a market top. What has occurred in the past is that the market tends to follow the downward trajectory of the equation until there is a "regime" change, when the market changes is collective mind and a new bull cycle begins. I have no idea how long the down trend will continue but I note that using the secular consolidation market evaluation metric of ten-year average earnings S&P PE ratio the market it overvalued by more than 100%. My guess is that we will remain in the 2000-2013 price range until demographics improve around 2022 when GenX comes into their productive mid forties.

    The reasoning behind the log-periodic power law nature of the market is that it represents the herding nature of investors. Normally we buy and sell and the market behaves quite randomly day to day. Then it seems we start moving together buying and selling all at the same time. If and when the market moves super-exponentially the buying frenzy creates an instability and cannot continue. Investors reverse course.

    Name:  NASDAQ LPPL 6-13-2013.JPG
Views: 272
Size:  102.4 KB
    Mike Scott
    Cloverdale, CA

  2. #2

    Sornette Power Law chart

    Mike, is there an approx price level/range here where in your opinion the pattern would be "broken" (to the upside)?

  3. #3
    Join Date
    Dec 1969
    Location
    Tarzana, CA
    Posts
    962
    Quote Originally Posted by adam ali View Post
    Mike, is there an approx price level/range here where in your opinion the pattern would be "broken" (to the upside)?
    The classic pivot or buy price is ten cents above the following (depends on the base pattern)

    Cup with handle: highest point in the handle
    Double bottom: highest point in the midpoint of the "W" formation
    Flat Base: highest point in the entire base

    IBD will tell you not to chase any higher than 5%. In my experience 5% is too far to chase unless the market is moving up briskly, 1% to 2% maybe. Special circumstances like gap ups force you to break this rule. Just keep in mind that if the gap starts to close you can reverse your trade and wait for further developments.

    Bounces off of the 50-day should be bought close to the 50-day. I decide in advance whether I can withstand another pull back to the 50-day plus some porosity without getting stopped out. If I think I can, I will make the trade. Pocket pivots should be bought close to the 50-day or 10-day moving average with the same consideration as the standard 50-day moving average bounce.

    If you further demand that the 50-day moving average be flat or upward trending you will do better as the stopping out point is moving in your favor.

    A study done by IBD from 1980-2006 and validated in Q1 2012 says that you will capture 80% of the leaders if you cut your losses at 3.4% below the exact proper buy point. So you can see that if you chase 5% beyond the proper buy point that that stop loss becomes 8.4%, a bit too large for me.
    Mike Scott
    Cloverdale, CA

  4. #4

    Power Law Chart

    Thanks for this, Mike.

    I want to make sure I was clear with my original question - I'm only speaking about the Sornette chart. Not being familiar with the maths involved in constructing it, I just thought I'd ask if there was in your estimation a level/range of price where the Power Law chart no longer "works". Right now it appears to be tracking very precisely.

  5. #5

    Didier Sornette

    Speaking of Sornette, here's a video of a recent TED Talk he gave:

    http://pragcap.com/didier-sornette-h...nancial-crisis

  6. #6
    Join Date
    Dec 1969
    Location
    Tarzana, CA
    Posts
    962
    Quote Originally Posted by adam ali View Post
    Thanks for this, Mike.

    I want to make sure I was clear with my original question - I'm only speaking about the Sornette chart. Not being familiar with the maths involved in constructing it, I just thought I'd ask if there was in your estimation a level/range of price where the Power Law chart no longer "works". Right now it appears to be tracking very precisely.
    Adam, now I understand. Here is an updated Log Periodic Power Law chart including a future trajectory. A significant departure of this chart would suggest that the scenario is not playing out. This post singularity part of the chart is created by reversing the tc and t terms in the indicated equation.

    Name:  LPPL June 17 2013.JPG
Views: 227
Size:  103.9 KB
    Mike Scott
    Cloverdale, CA

+ Reply to Thread

Posting Permissions

  • You may not post new threads
  • You may not post replies
  • You may not post attachments
  • You may not edit your posts