6-13-2013 Before the Open Comments
The NASDAQ MarketSchool Exposure Model went to correction yesterday, one day after IBD placed the market in correction. We had distribution on the NASDAQ giving us a full distribution count and also closed below the 21-day ema (two market sell signals).
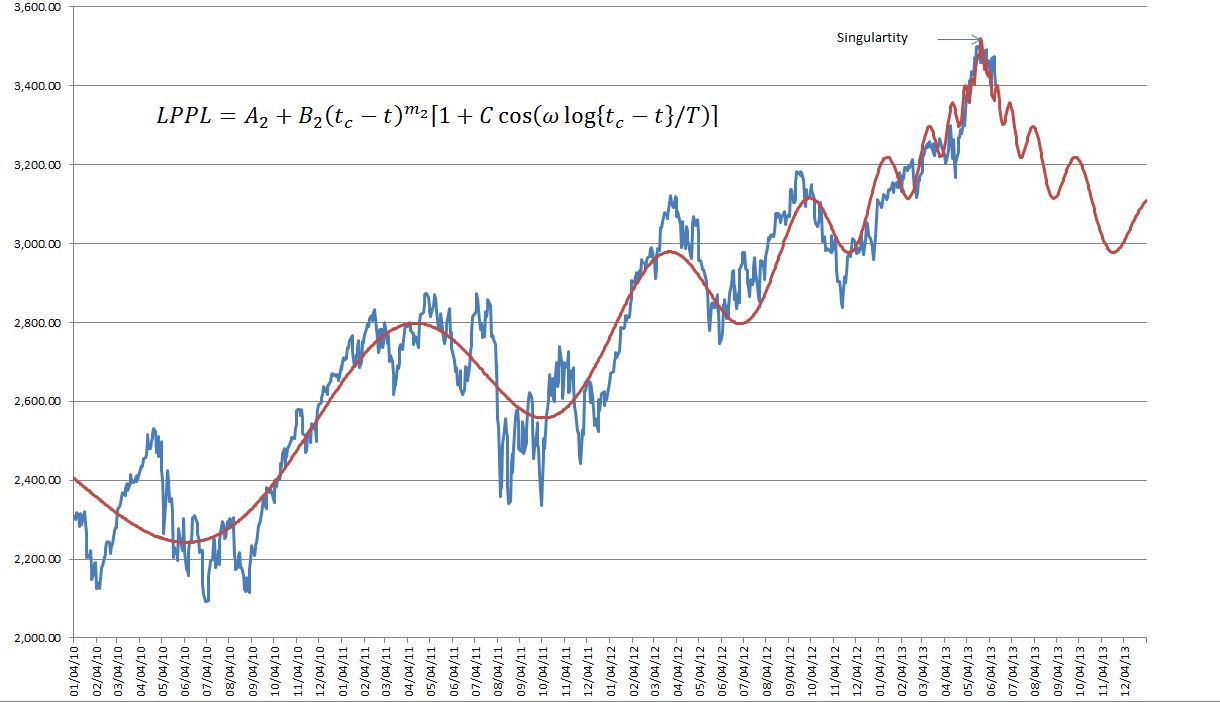
The chart below is the updated Didier Sornette Why Markets Crash chart showing now the projected trajectory after the probable top. The singularity in the equation occurred on May 22, the actual day of the top. Didier says that the singularity is usually good for plus or minus a week or two. So this just happened to be right on. The post-singularity curve is created by reversing the tc and t terms (critical date and current date) in the equation. The interesting thing to me is that the log-periodic nature of the curve shows high frequency oscillations close to the singularity which is why possibly it is so difficult to short when close to a market top. What has occurred in the past is that the market tends to follow the downward trajectory of the equation until there is a "regime" change, when the market changes is collective mind and a new bull cycle begins. I have no idea how long the down trend will continue but I note that using the secular consolidation market evaluation metric of ten-year average earnings S&P PE ratio the market it overvalued by more than 100%. My guess is that we will remain in the 2000-2013 price range until demographics improve around 2022 when GenX comes into their productive mid forties.
The reasoning behind the log-periodic power law nature of the market is that it represents the herding nature of investors. Normally we buy and sell and the market behaves quite randomly day to day. Then it seems we start moving together buying and selling all at the same time. If and when the market moves super-exponentially the buying frenzy creates an instability and cannot continue. Investors reverse course.

Mike Scott
Cloverdale, CA


 Reply With Quote