-
Deflation Seems To Be Coming On - Why are Bond Prices Falling?
Hi-
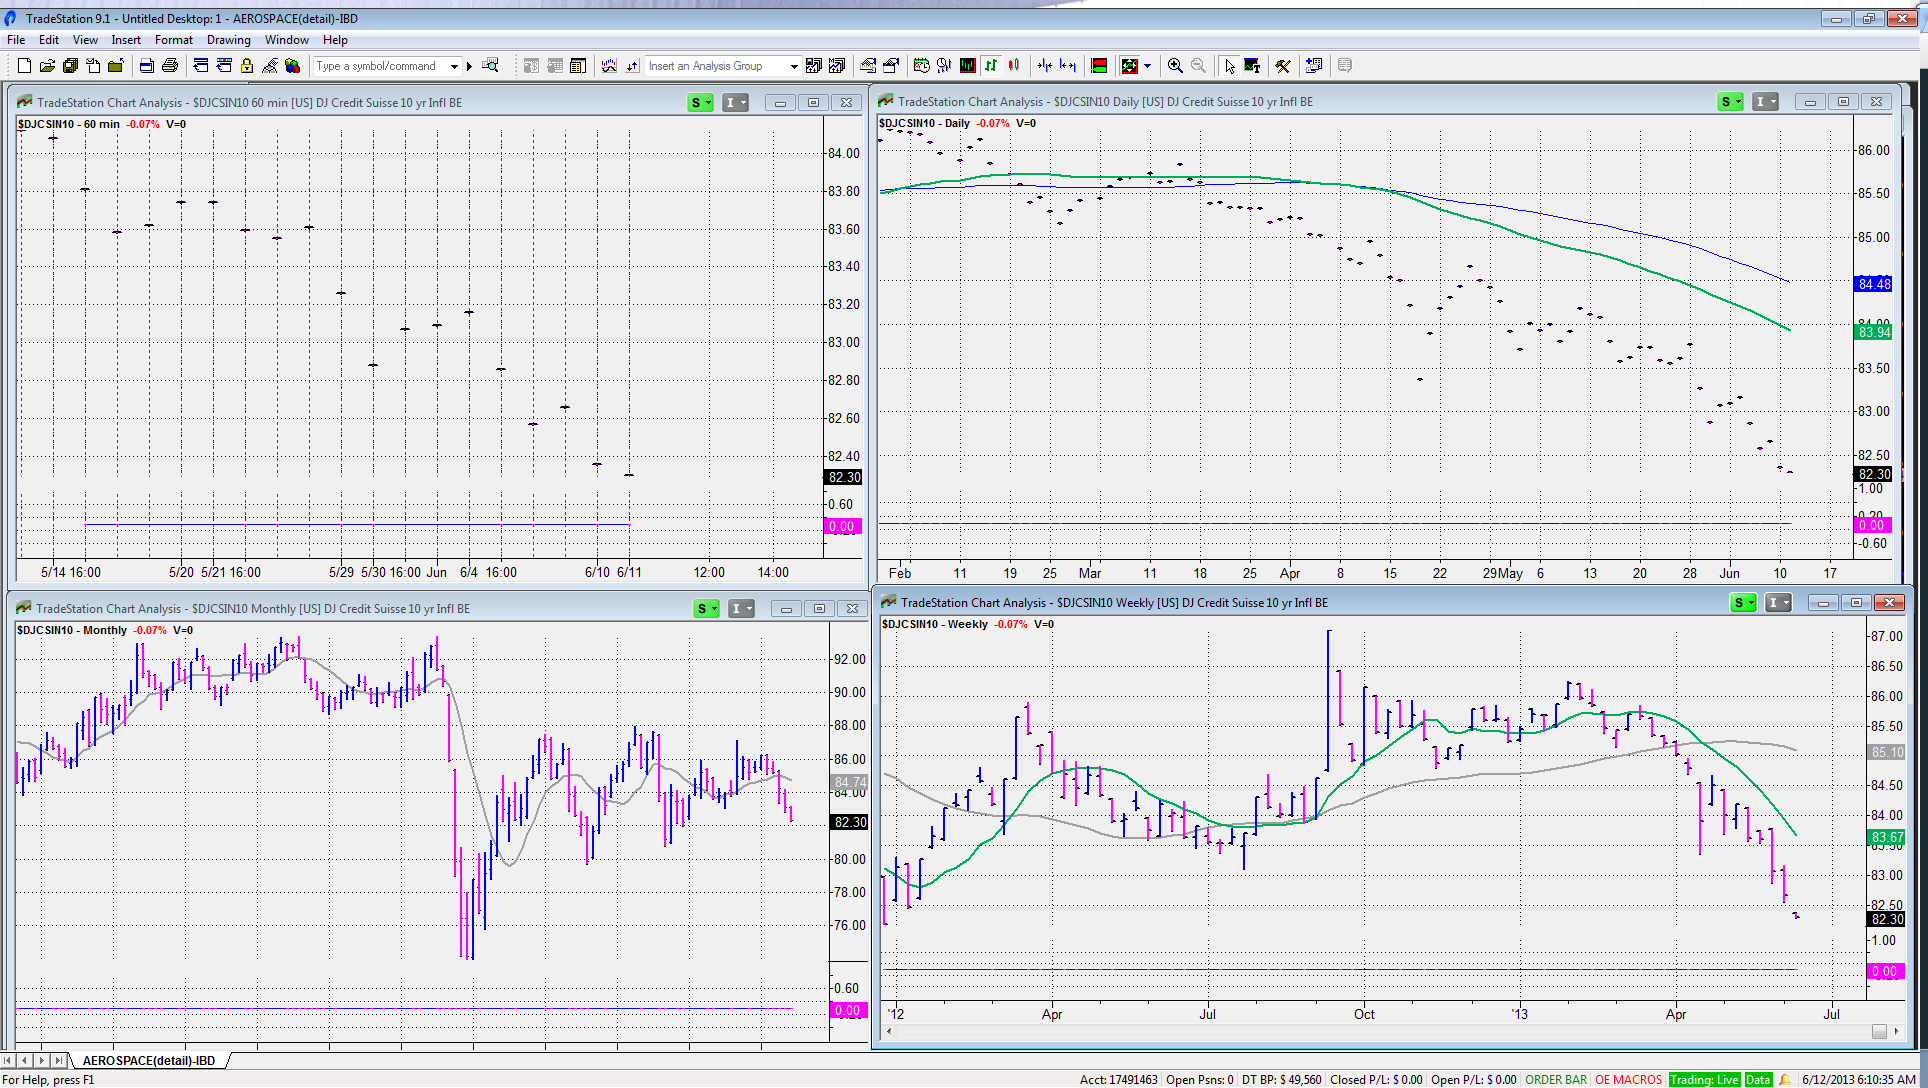
Along these lines, I was wondering if anyone has noticed that the Dow Jones Credit Suisse 10 yr Inflation Breakeven Index ($DJSCIN10) Charts are showing that inflation is decreasing - in what appears to be an increasing fashion (see the attached hourly, daily, weekly & monthly charts). $DSCSIN10 is a measure of what the market's US Inflation rate expectations are for the next 10 years. I keep similar measures in a standalone .xls across 10 yr and 5 Yr inflation and they agree with this index.
Now, look at charts of TLT (long term US Treasuries) for the same time frames:
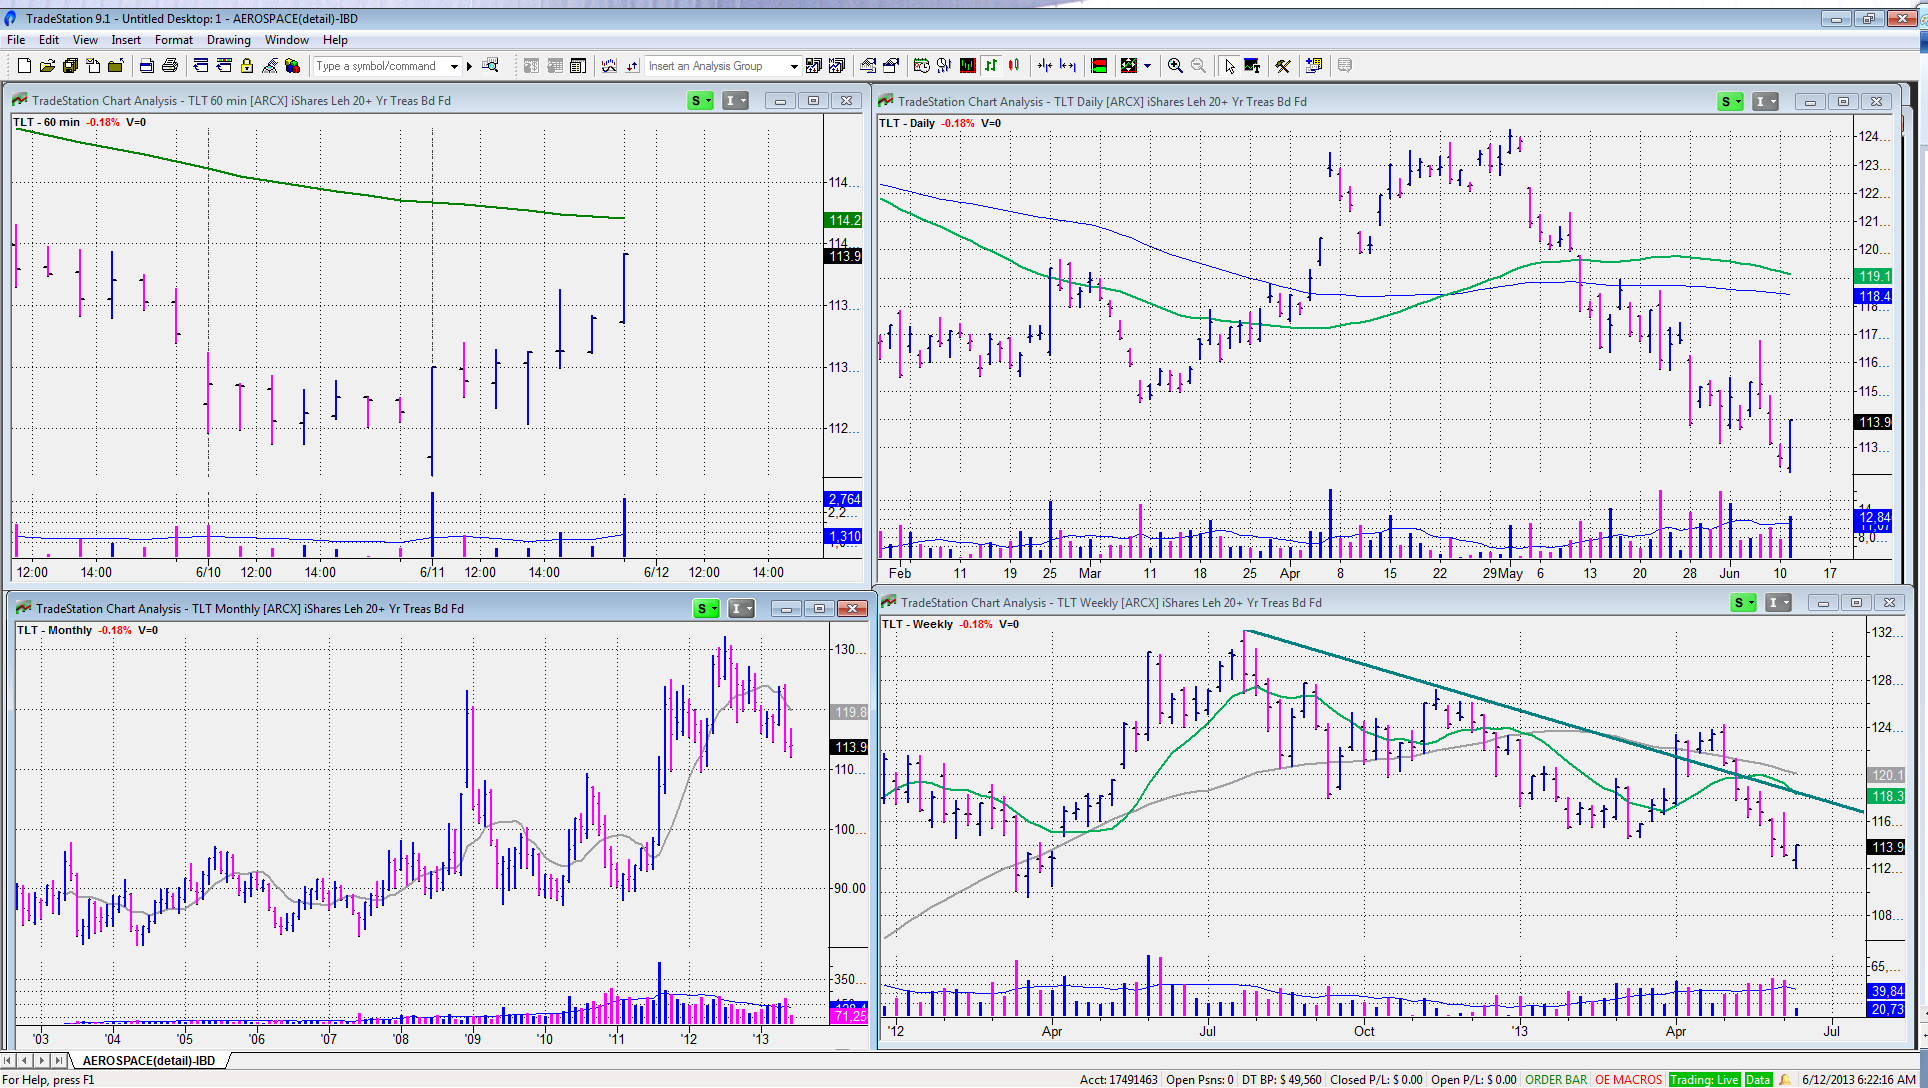
So, we have a situation where inflation is falling and bond prices are also falling??
Bond prices are directly related to 1) inflation expectations, and 2) creditworthiness.
So, it looks like the perceived creditworthiness of debtors across various debt instruments has been falling significantly faster than the perceived rate of deflation has been rising since at least the beginning of May 2013. See weekly charts of LQD (Intermediate Term Corp) & JNK (Hi-Yield).
Its said that bond traders are smarter than equity traders, and that bond markets lead equities on macro economic trends (e.g. look at how bonds signaled troubles prior to equity markets in the Fall of 2008).
Bond investors appear to be pricing in a greater risk of non-payment of capital, including default by debtors - including the US Govt. (Note in Q4 2008, TLT rose while LQD fell, at this time US govt bonds are also affected). I would guess that the Japan experiment has been the catalyst for bondholders to re-think creditworthiness across all debtor classes.
A trend is not made of a single week or two, but this incipient trend has been in place for 4-5 weeks, so it bears watching.
Something to ponder,
Shawn
 Posting Permissions
- You may not post new threads
- You may not post replies
- You may not post attachments
- You may not edit your posts
Forum Rules


 Reply With Quote