-
05/19/2013 Mousetrap
Sector Model XLB 5.74%
Large Portfolio Date Return Days
BBRY 7/16/2012 101.66% 307
CAJ 9/25/2012 7.85% 236
BOKF 2/4/2013 17.87% 104
SWM 2/12/2013 26.56% 96
MWW 4/11/2013 14.96% 38
ABX 4/11/2013 -24.04% 38
TPX 4/22/2013 4.11% 27
NYCB 4/24/2013 3.61% 25
TTM 5/6/2013 4.66% 13
DLB 5/13/2013 0.35% 6
S&P Annualized 11.53%
Sector Model Annualized 27.16%
Large Portfolio Annualized 33.67%
S&P Total 23.96%
Sector Model Total 60.47%
Large Portfolio Total 77.05%
Sector Model Advantage 15.63%
Large Portfolio Advantage 22.14%
Since 5/31/2011, the large portfolio of ten stocks has risen 77.05%.
On an annualized basis (just shy of two years), thats 33.67% per year, which is a 22.14% advantage over the S&P.
On January 1, the model had a total return of 46.63%.
Year to date, then, the model is up 20.74%.
No bragging points; the entire market has been on a tear.
And that leaves us to the question of what the market sectors are telling us.
Sam Stovall has a graphic of the sector rotations embedded in a typical market cycle:
http://stockcharts.com/freecharts/img/SectorCycle.jpg
On this graphic Ive mapped the stocks that the model has selected to their native sectors:
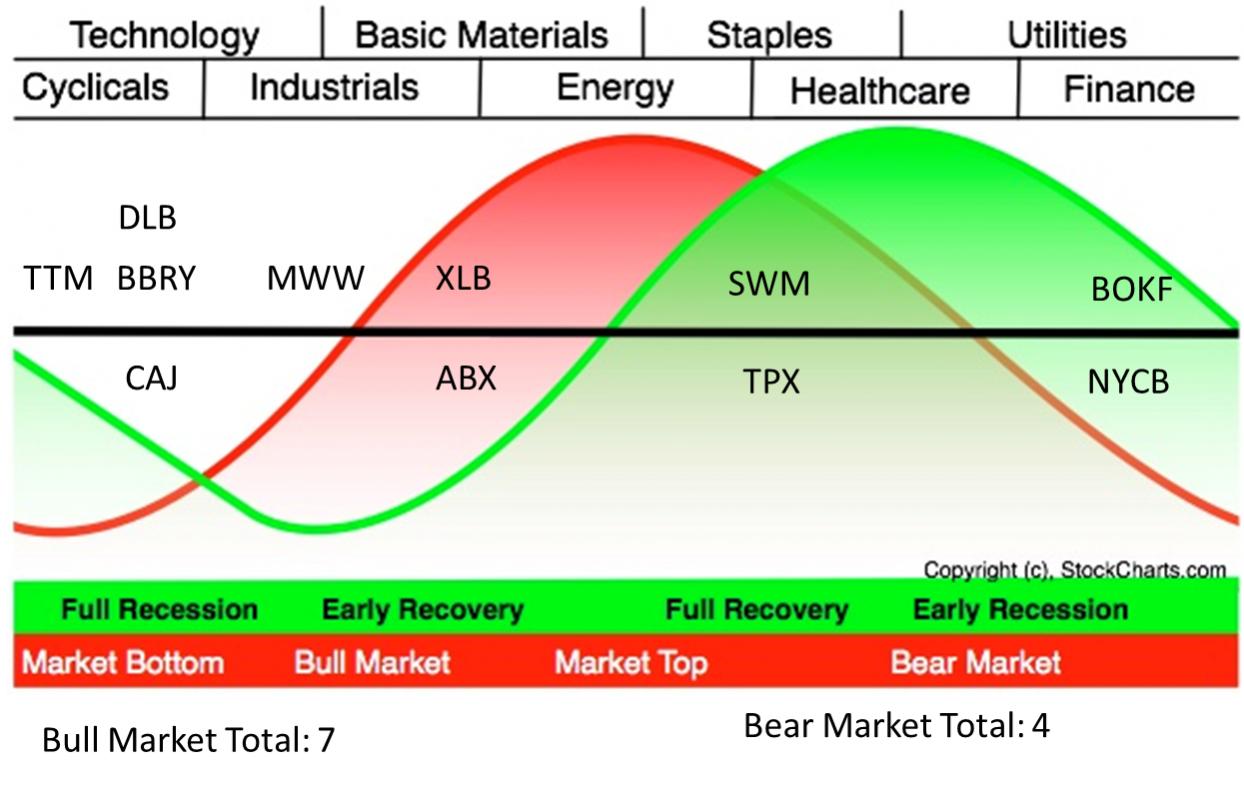
On the left hand side is a bull market. On the right side is a bear. The model appears to be targeting bullish sectors by a factor of two to one.
The average spread of ALL stocks in the model centers on a market bottom.
I mentioned this a few days ago, and I need to elaborate. For the past two years, anyone looking at sector relationships would have been bearish almost the entire time. For months I even listed the model as indicating a bear market, even though the market was going up almost the entire time. I kept getting questions about it, and after the twentieth time explaining that this was some kind of extended bear market rally, I finally shrugged my shoulders and stopped listing it on the blog.
But I kept watching it, with almost a morbid curiosity, as the sectors SLOWLY ground their way from a bear market top to a cyclical bottom which is where the model is now.
This market has been a disaster for most hedge funds, with good reason: the market hasnt made any technical sense, outside of QE. This has been Bernankes market the entire time.
In six months Bernanke will be exiting stage left, and QE will likely take a bow with him.
And yet the market is accelerating.
I believe, as I noted a few days ago, that we are entering a self sustaining cyclical bull market which will last until 2016 (earliest) to 2018 (latest).
The cause is demographics, as noted here:
http://market-mousetrap.blogspot.com...re-debate.html
and here:
http://market-mousetrap.blogspot.com...-bernanke.html
The PROBLEM is whether these numbers can have any solid meaning in this environment of competitive currency devaluation. If Bernanke has been able to turn a bear market into a four year rally, will his exit turn a bull market into a four year correction?
I dont know.
No one knows.
Bernanke doesnt know. Thats why hes happy to retire. Hes done his job. Now its up to our dysfunctional government to begin to do their job instead.
My model has been long a bear market that went up, and will be long if we have a bull market that goes down. In a world turned on its head, traditional market timers will lose money to us dumb clods who pick undervalued stocks and grit our teeth through market gyrations cooked up in an LSD phantasm.
My point is this: dont TRY to over-think this. Some things do NOT make sense.
Ned Davis asked a question we should always keep in mind: Would you rather be right, or make money?
Most of us, believe it or not, would rather be right. Its not that we dont WANT to make money, but that we want an excuse to blame when we DONT.
Tim
Last edited by Timothy Clontz; 05-19-2013 at 10:47 AM.
Reason: Getting the graphic to work
 Posting Permissions
- You may not post new threads
- You may not post replies
- You may not post attachments
- You may not edit your posts
Forum Rules


 Reply With Quote