Anatomy of a Short Sale
Stocks often take many months to set up a high probability short sale. I tend to short liquid stocks that have been leaders in the prior rally meaning that they have often advanced 100%-1000% from the prior low to a top. They are also stocks that I may have traded on the advancing portion of their run. Often people try to short too early after they believe a stock might be topping. This is often too volatile of a place to safely enter short. The volatility comes from short takers piling in only to be met by the bargain hunters that see a great stock at a cheaper price. The bargain hunters force the short takers to cover their positions.
What we need for a stock to really decline is for the bargain hunters and the early short takers to give up on the stock. This is similar to the situation on the up side where we wait for the weak holders of a stock to give up on the stock over the length of time that the stock is in a basing pattern. When the weak holders have given up a breakout to the upside is much more likely to not be met by a wave a selling. So returning to the short side, if the bargain hunters and short takers have moved on, we are in a situation where the market forces can work. This can take months.
Consider the following schematic drawing of a Head and Shoulders Topping pattern. After a stock has been rising for one to 5 years or more where it has formed multiple bases or consolidations on the way up the stock eventually forms late-stage consolidations that are often flawed. Shown on the diagram is the Head region that may or not be a legal basing structure. The primary characteristic to look for is what happens on the right side of the head. A good H&S pattern will show a high volume sell off in this region. This is a primary clue to look for. What is happening is that selling and short taking are causing the stock to break down on obvious volume. Fairly soon in this sell off (usually when undercutting a prior low area or significant moving average) the bargain hunters engage forcing the shorts to cover. This process of selling off and rallying happens again and again until they give up and look elsewhere. I look for 3 plus or minus 2 rallies of this sort. By analyzing the price and volume character of each rally you come to discover perhaps one rally that really lacks force or is stalling out. This is your indication that the short taking point may be near. This may be multiple months away from the actual top.
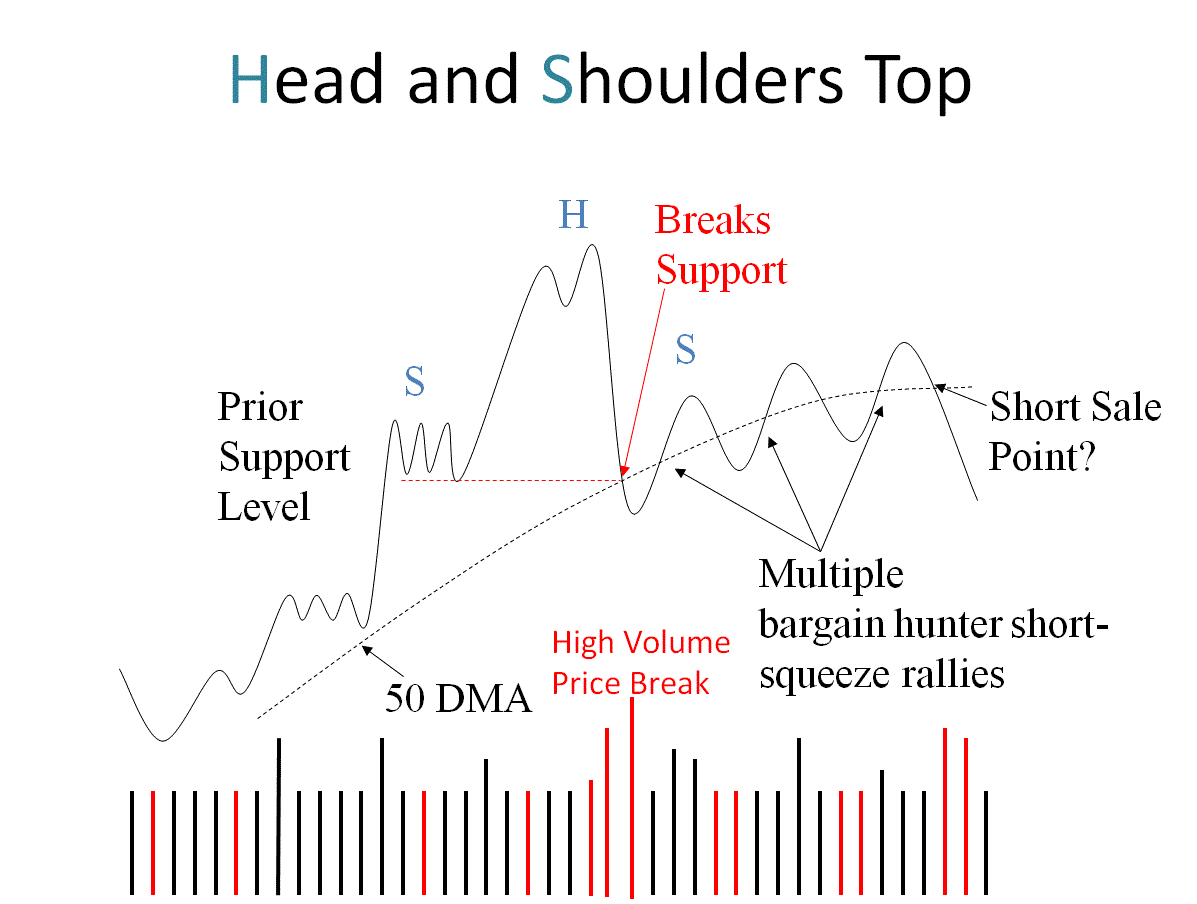
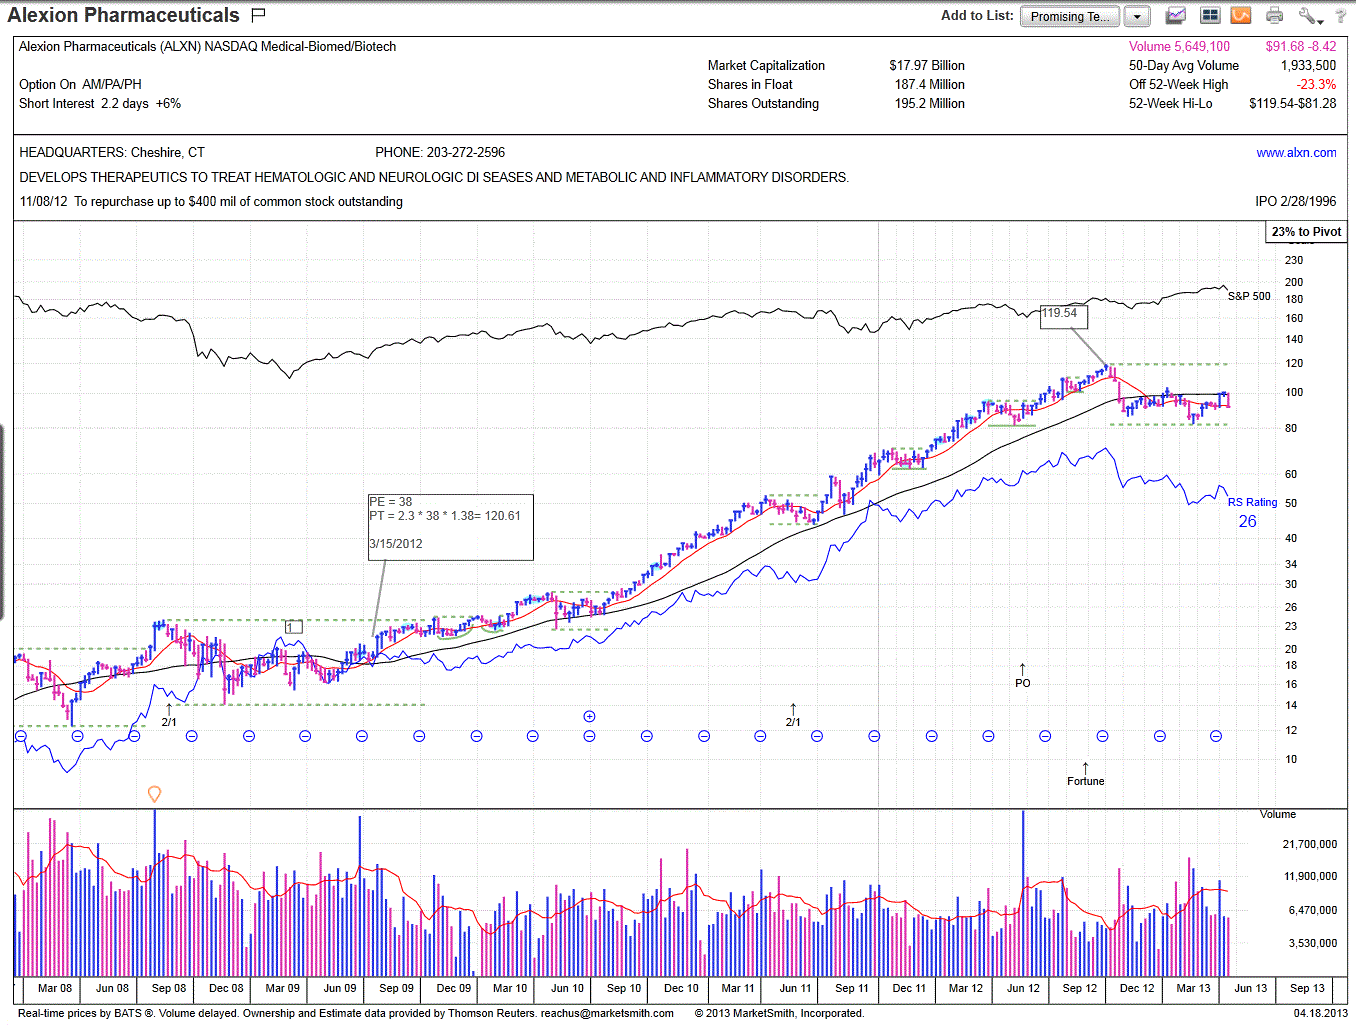
The short taking place is not where you are undercutting a prior low but more properly higher up in the structure such as when undercutting a key moving average such as the 50-day. There are times in the right hand multiple shoulder regions where the price rallies into either the 200-day or 50-day and appears to stall out. This is my favorite place to short. The moving average provides a clear place to exit the trade if I am wrong. So if you can short within 1 or 2% of the average, this is your risk. Your potential is to the downside. A good short candidate should have the next level down prior price low 20% or more lower than your short taking point as this is where you will plan to cover your position. So now for a current example. I placed a short trade on ALXN on Monday at about $100. The following chart shows the set up on a weekly chart.
Note that this is a H&S pattern and that there was a high volume sell off on the right side of the head. In 2009 I made a P/E expansion price target of 120.61. This was my estimate of where the stock could go if the P/E at the first stage base breakout expanded by 130%. The price target uses the 2011 earnings forecast at the time of the breakout. Note that the topping price was within 1% of this target. This give me some conviction that the top is in. My short taking place looks fairly obvious as the stock rallies into the 40-week moving average and stalls.
I was asked in a private message why would I short ALXN and not GOOG for example. I don't see a proper set up in GOOG, there is no high volume sell off marking a head structure. There was a high volume sell off in October 2011 but the subsequent rise in price invalidated the pattern, a right shoulder needs to be lower than the head. Also compare ALXN gains since the 2009 lows to GOOG. GOOG traded flat for years when ALXN was soaring. I believe that EV techniques can assist in selection which rally to short. Those rallies in the right hand structure that show diverging large player strength would be a clue to watch for. Many okay short taking places however don't show this behavior.
For a classic set up look at AAPL on a weekly chart. You will notice very heavy selling beginning right after the top that was made after AAPL broke out of a 5th stage base (very late stage). It also almost achieved the $718 price target calculated in March of 2009. Also note that now the 10-week moving average is serving as the price ceiling for the subsequent move. AAPL was shortable in late 2012 when a very week rally into the 10-week occurred. Clearly the bargain hunters never engaged heavily. Several other rallies into the 10-week were also good places to enter short.
By the way. If you were a large institutional player with a massive position in AAPL what would you do? I think once consideration would be to show up on CNBC and talk about how cheap AAPL is to entice you to buy their shares.
Mike Scott
Cloverdale, CA


 Reply With Quote