+ Reply to Thread
Results 1 to 7 of 7

Thread: 20DMF

  1. #1

    20DMF

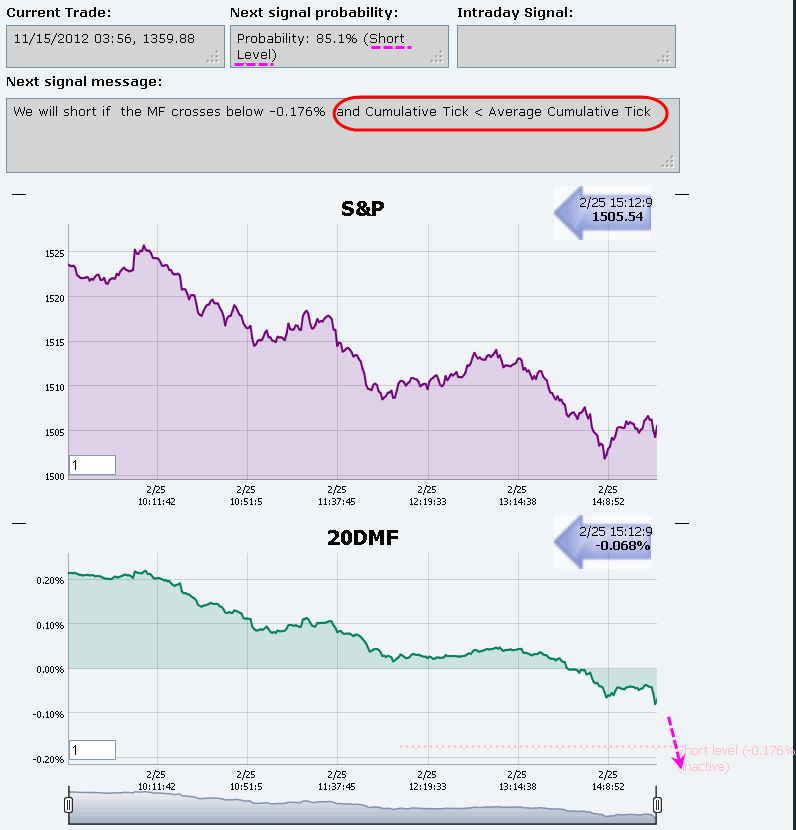
    Please note that the probability is the probability that we reach the short level before the close. However, a short signal cannot be issued while the Cumulative Tick is above the average.

    Hence, even if we reach the pink short level, we will need to wait for a cumulative Tick confirmation.
    On the EOD model, the confirmation is still done through the inversed ETFs.

    The short level is almost invisible, because it is "not active" due to the Cumulative Tick being above the average.


    pascal

    Name:  20DMF RT.gif
Views: 635
Size:  31.0 KB

  2. #2

    Average Cumulative Tick

    Pascal,

    How do you calculate avg cum tick or is that proprietary?

  3. #3
    Quote Originally Posted by Pascal View Post
    Please note that the probability is the probability that we reach the short level before the close. However, a short signal cannot be issued while the Cumulative Tick is above the average.

    Hence, even if we reach the pink short level, we will need to wait for a cumulative Tick confirmation.
    On the EOD model, the confirmation is still done through the inversed ETFs.

    The short level is almost invisible, because it is "not active" due to the Cumulative Tick being above the average.


    pascal

    Attachment 17438
    Pascal, I know this has been mentioned many times but I still have difficulty matching your Cumulative Tick chart.

    All the ones I watch on Tradestation, (the 1200 min averages on the Russell 2000, the NYSE and the All US Tick) are all trending down at this present time and have been for some time.

    Why do you think there is this discrepancy ?

    Trev

  4. #4
    Quote Originally Posted by adam ali View Post
    Pascal,

    How do you calculate avg cum tick or is that proprietary?
    It is the 1200Minutes Simple moving average


    Pascal

  5. #5
    Quote Originally Posted by manucastle View Post
    Pascal, I know this has been mentioned many times but I still have difficulty matching your Cumulative Tick chart.

    All the ones I watch on Tradestation, (the 1200 min averages on the Russell 2000, the NYSE and the All US Tick) are all trending down at this present time and have been for some time.

    Why do you think there is this discrepancy ?

    Trev
    The system temporarily stopped for 30 minutes due to some Java update that forced a restart.
    The Minute Cumulative Tick data are coming directly from IQFeed. It is a one minute sample of the tick data. System that sample data faster such as every 10 sec, show a steeper decline.

    However, the 20DMF system is based on the minute data and the Cumulative back-test was performed on minute data. Hence, we keep the minute tick data as it is for the 20DMF to issue its signals.


    Pascal

    Name:  20DMF RT.gif
Views: 720
Size:  15.8 KB

  6. #6
    Hi Pascal,

    It's 3:57. The tick seems to fall below avg, but the message is not updated to a short. Can u confirm that short signal is triggered?

    Thanks.


    Quote Originally Posted by Pascal View Post
    The system temporarily stopped for 30 minutes due to some Java update that forced a restart.
    The Minute Cumulative Tick data are coming directly from IQFeed. It is a one minute sample of the tick data. System that sample data faster such as every 10 sec, show a steeper decline.

    However, the 20DMF system is based on the minute data and the Cumulative back-test was performed on minute data. Hence, we keep the minute tick data as it is for the 20DMF to issue its signals.


    Pascal

    Attachment 17439

  7. #7

    20DMF

    A short will be confirmed if we stay below the average by the close.


    pascal

    Name:  20DMF RT.gif
Views: 215
Size:  17.6 KB

+ Reply to Thread

Posting Permissions

  • You may not post new threads
  • You may not post replies
  • You may not post attachments
  • You may not edit your posts