


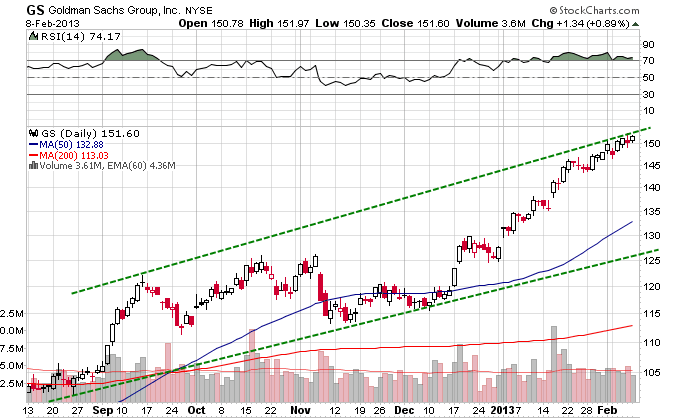
Pascal - just wondering (as a newbie) why on some of your Active Boundaries charts that the Neutral Price is sometimes less than the Lower Boundary? For example here is GS from Feb 7, 2013.


Pascal - just wondering (as a newbie) why on some of your Active Boundaries charts that the Neutral Price is sometimes less than the Lower Boundary? For example here is GS from Feb 7, 2013.

Thanks for the question, which is not trivial at all.Originally Posted by engr_358

The Active Boundaries are a way to measure the value of a stock in the eye of active traders.
We first determine how many shares are needed to get a regular pattern in the waves of profit/losses for a given group of shareholders (which we name the Active shareholders.)
These are the shareholders who buy when the average collective profit is low and then sell when it is high. They continue this process until there is a big change in the potential valuation itself due to for example a specific Fed decision or an earnings miss.
What AB therefore does is to catch the upper and lower trend-lines of a price trend. When the upper trend line is reached, active shareholders would likely start selling. However, as they sell, they are replaced by other active shareholders who want to get a profit on their investment and are thus unlikely to sell. This action lowers the collective profit of this group of shareholders and the AB pattern starts reverting down (The shares that carried a profit of 20% for example are replaced by shares carrying a profit of 0%.) AB is thus an oscillator that mathematically reverts back to 0% (NB.)
The Lower Boundary is the lower price trend line measured in percentage gains. The LB therefore measures the extend of the average profit pull-back for the set of active shareholders. Usually, it is negative. However, stocks that are in a strong uptrend do not necessarily have to pull-back to a negative territory. If there is enough money to push the price up, shallow pull-backs will be bought. This is the reason why for GS, which by the way gained 50% in the past 6 months - the fate accomplished by mostly dot com stocks in the old days - displayed a LB higher than NB.
This sort of trend is unsustainable, because mathematically, the AB indicator has to revert to 0%. However, this could take quite long.
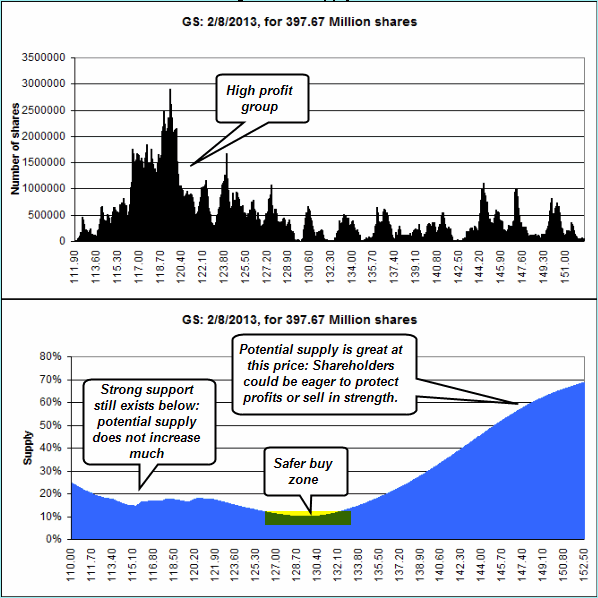
By the way, below is a view of the GS shares supply Figure with explanations.
Pascal
 Posting Permissions
 Reply With Quote