

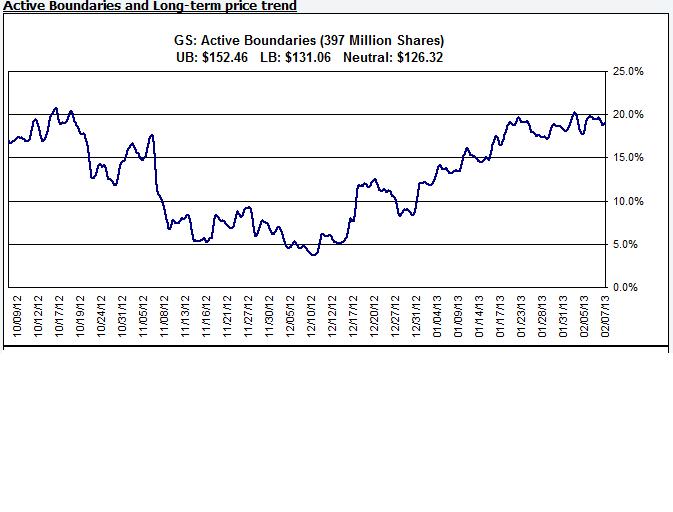
Pascal - just wondering (as a newbie) why on some of your Active Boundaries charts that the Neutral Price is sometimes less than the Lower Boundary? For example here is GS from Feb 7, 2013.


Pascal - just wondering (as a newbie) why on some of your Active Boundaries charts that the Neutral Price is sometimes less than the Lower Boundary? For example here is GS from Feb 7, 2013.
 Posting Permissions

 Reply With Quote