Yesterday, the model issued a Buy Oversold signal. This is a valid signal and I believe that we have time until the main miners issue their earnings by mid of February.
Below is the Figure that I posted yesterday, stating that we were on the red line. However, since we moved above the Oversold level, we are now at the more advantageous pink line.
You can also see below that GDX has attracted much selling: the extension of the TEV below its average is very strong (Shown by the red arrow.)
If we look at the timing of such strong negative TEV extension, we can see that they occur just before major reversals. They could be indicating either retail investors liquidating or funds opening short positions as an hedge against their long positions in individual stocks.
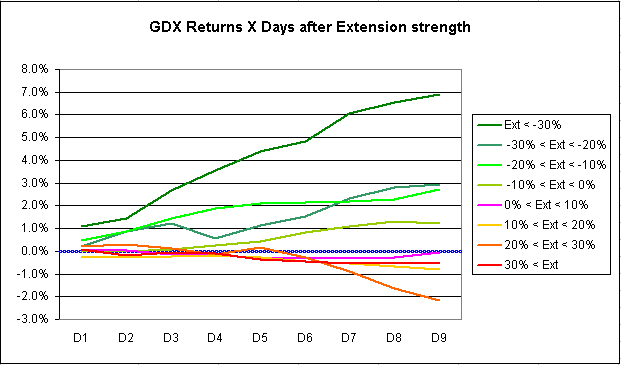
Nobody really knows the reason, but the Figure below shows a strong inverse relation between the extend of the TEV extension and the average returns of the next days. Strong negative GDX TEV extensions are shown by the dark green line.


 Reply With Quote