-
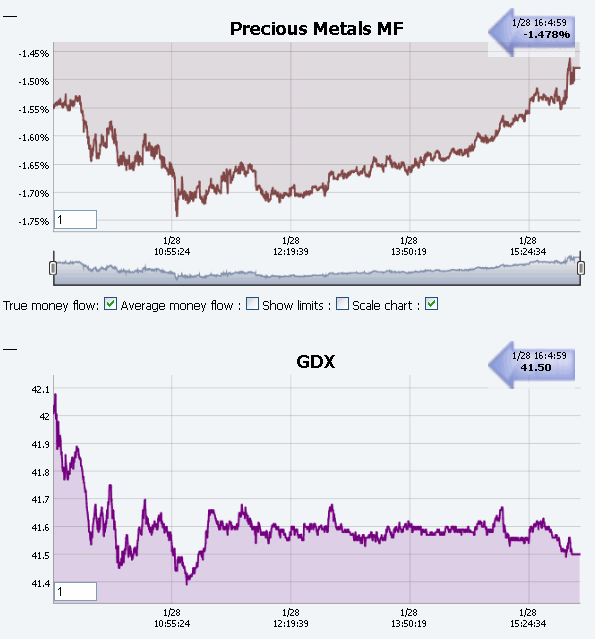
GDX Intraday positive divergence
As you might have noticed, yesterday, we had a positive MF divergence, indicating that the bottom might be close, because investors started buying weakness.

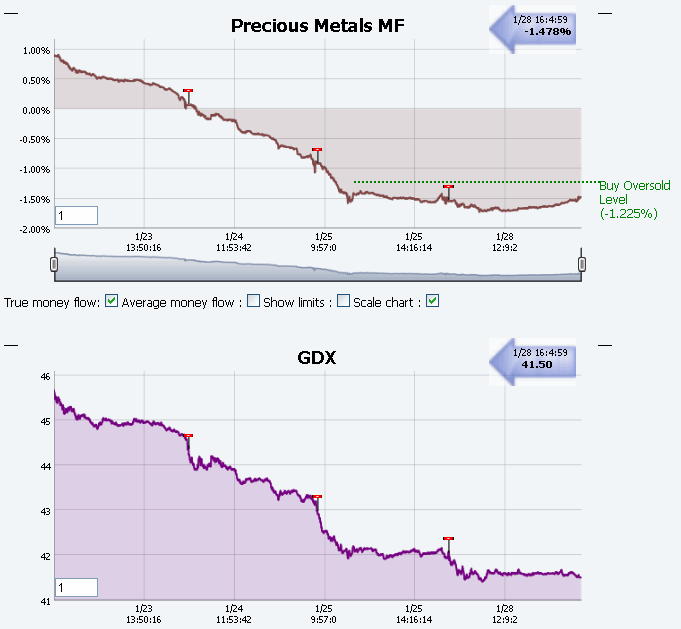
When comparing this move to the past few days, it is however obvious that large buyers are not back in full strength yet.

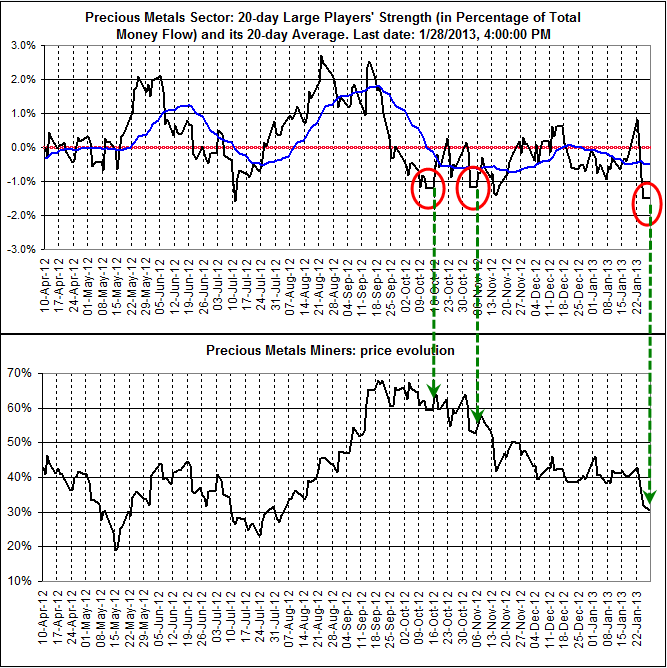
We can see in the Figure below that we had two similar events in the past months and although we did experience a small bounce, the downtrend did not reverse.

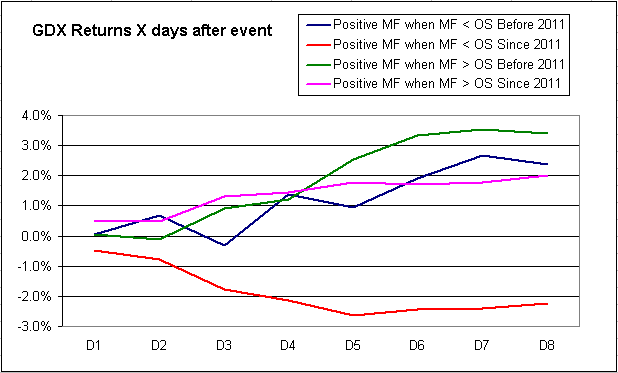
I therefore did some further calculations to see what happened after the MF reversed from an oversold situation. I however split this analysis into four cases: since 2011, between 2009 and 2011 (labeled before 2011,) with a MF below the OS level of -1.3% or above the OS level of -1.3% (but still below -1%).
The results are shown below. We can see that between 2009-2011, when GDX was mainly in a bull market, it was good to buy weakness below -1% or even below -1.3%. However, since 2011, buying extreme weakness (a MF below -1.3%) has let to losing trades (2/3 of the trades were losing trades.)
Today is such a case: we are in the conditions of the red curve. Hence, the positive divergence of yesterday is not a sign that the sector will reverse. It is better to wait for a buy signal to be issued and even then, we need to be very cautious as we are heading into what will probably be disappointing PM miners earnings.

Note that the Oversold level indicated in the RT system includes a porosity factor.
 Posting Permissions
- You may not post new threads
- You may not post replies
- You may not post attachments
- You may not edit your posts
Forum Rules


 Reply With Quote