-
1/19/2013 Mousetrap: selling PAAS; buying STRA (again)
Small Portfolio XLU & IAU 19.53%
Sector XLU 29.86%
Secular IAU 9.19%
Large Portfolio Date Return Days
RIMM 7/16/2012 118.48% 187
SEAC 9/25/2012 31.82% 116
CAJ 9/25/2012 9.56% 116
DDAIF 9/25/2012 12.06% 116
CFI 10/31/2012 40.24% 80
RE 11/26/2012 8.01% 54
CGX 12/12/2012 9.48% 38
PAAS 12/20/2012 2.96% 30
OKE 12/28/2012 11.34% 22
HTSI 1/14/2013 0.46% 5
S&P Annualized 6.26%
Small Portfolio Annualized 11.49%
Sector Model Annualized 17.27%
Large Portfolio Annualized 34.95%
S&P Total 10.46%
Small Portfolio Total 19.53%
Sector Model Total 29.86%
Large Portfolio Total 63.49%
Small Portfolio Advantage 5.23%
Sector Model Advantage 11.02%
Large Portfolio Advantage 28.69%
NOTE: all return numbers are from the launch of the live model on 5/31/2011.
Rotation: selling PAAS; buying STRA (again).
As always, a negative gap will cancel the trade.
Ive included more numbers today because the model is approaching a milestone I never thought it could reach: outperformance over the S&P by 30% (not there yet, but REAL close).
Ill have more to write tomorrow. Many thanks to Bill Spetrino for taking note of my tax revenue studies in Newsmax:
http://market-mousetrap.blogspot.com...r-newsmax.html
quoted here:
http://www.moneynews.com/BillSpetrin...1/18/id/472009
Theres more detail to give on WHY 35% tax rates is the point of contention, and the coming tax rate war between the Federal government and the States. But thats for tomorrows post.
Tim
-
States of Confusion
States of Confusion
From: http://market-mousetrap.blogspot.com...confusion.html
Cognitive dissonance is what happens when we compartmentalize contradictions.
Theres one more curve to throw into the mix: the Krugman curve. Paul Krugman has never claimed it, but Im officially nominating him right now
The Laffer curve is the maximum progressive Federal tax rate.
The Krugman curve is the maximum progressive academic tax rate.
In theory the Krugman curve would be identical to the Laffer curve. Economic studies are nearly unanimous in placing the peak of the Laffer curve between 65% to 70% maximum progressive tax rates, which is the same as 35% average tax rates.
My own calculations placed the idealized capital gains maximum at 35%, which would create a maximum revenue point on progressive tax rates at 65%. That is, capital gains are flat rates, so a 35% average is the same as a 5% to 65% progressive tax.
So then, Paul Krugman and I agree with virtually all mathematical studies of the Laffer curve: a progressive tax rate should peak at 65% (which is an average of 35%).
And yet
my historical graph of actual per capita revenues shows a peak when the maximum tax rates are at 35% -- not 65%.
When I first produced that graph I had to scratch my head, because the graph for maximum progressive IRS revenues was identical to the curve of where average revenues should be.
It was perfect.
It was also perfectly wrong.
And there are exactly 50 reasons for it to be wrong: Alabama, Alaska, Arkansas
..
Right, the Federal government only gets part of our taxes. The states get another part. That 35% average or 65% maximum is for all taxes put together not just the IRS. When you plot the actual IRS revenues, then, you can only plot the Federal governments share.
The Laffer curve is whats left of the Krugman curve after reality takes a bite out of it.
Add all State and Local taxes together, and theyve cut that 65% maximum down to the 35% maximum we see from actual Federal revenues:
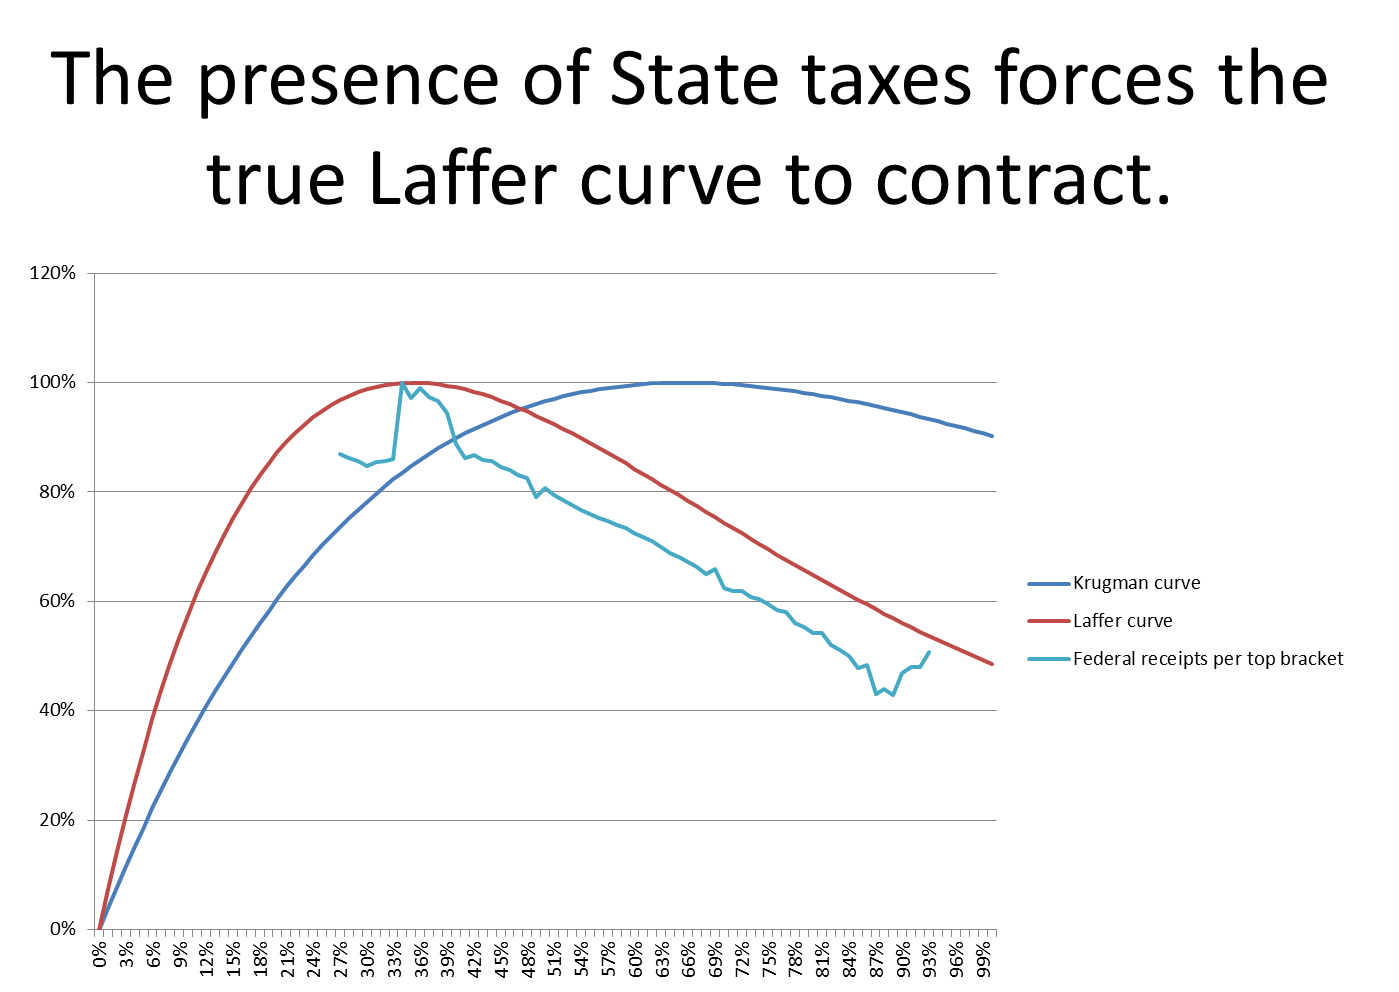
Art Laffer himself never gives an actual number for the peak, because it is impossible to do so unless you also know what other taxes are forcing the curve to contract.
A European VAT tax at 20% would cause the Laffer curve to peak at a 25% max / 15% average.
The State and Local taxes are also close to 20%, but many of them can be deducted from your Federal taxes, leaving us with the 35% max / 20% average for the historical IRS revenues.
Occasionally youll see an economist laugh at Conservatives who point to the true peak at 35%, because the math very clearly shows it SHOULD be at 65%. And, unfortunately, Liberals tend to stick with the Krugman curve as well.
Krugman and the Liberals would be 100% correct if there were only one tax in the entire country.
So, their math is perfect.
And it is also perfectly wrong.
So, thats the back story: in the absence of all other taxes, the average tax rate would be 35%; but the presence of other taxes turns that 35% average into a 35% maximum.
So what are all those other taxes? On the state level, here are some categories from the United States census bureau:
(Source http://www.census.gov/govs/statetax/...ical_data.html )
Property Tax (T01)
Tot Sales & Gr Rec Tax
Total Gen Sales Tax (T09)
Total Select Sales Tax
Alcoholic Beverage Tax (T10)
Amusement Tax (T11)
Insurance Premium Tax (T12)
Motor Fuels Tax (T13)
Parimutuels Tax (T14)
Public Utility Tax (T15)
Tobacco Tax (T16)
Other Select Sales Tax (T19)
Total License Taxes
Alcoholic Beverage Lic (T20)
Amusement License (T21)
Corporation License (T22)
Hunt and Fish License (T23)
Motor Veh & Oper Lic
Motor Vehicle License (T24)
Motor Veh Oper License (T25)
Public Utility License (T27)
Occup and Bus Lic NEC (T28)
Other License Taxes (T29)
Total Income Taxes
Individual Income Tax (T40)
Corp Net Income Tax (T41)
Total Other Taxes
Death and Gift Tax (T50)
Docum and Stock Tr Tax (T51)
Severance Tax (T53)
Taxes NEC (T99)
Yeah, some of those overlap, but who can keep track?
Tim
-
Civil War
From: http://market-mousetrap.blogspot.com...shot-cuts.html
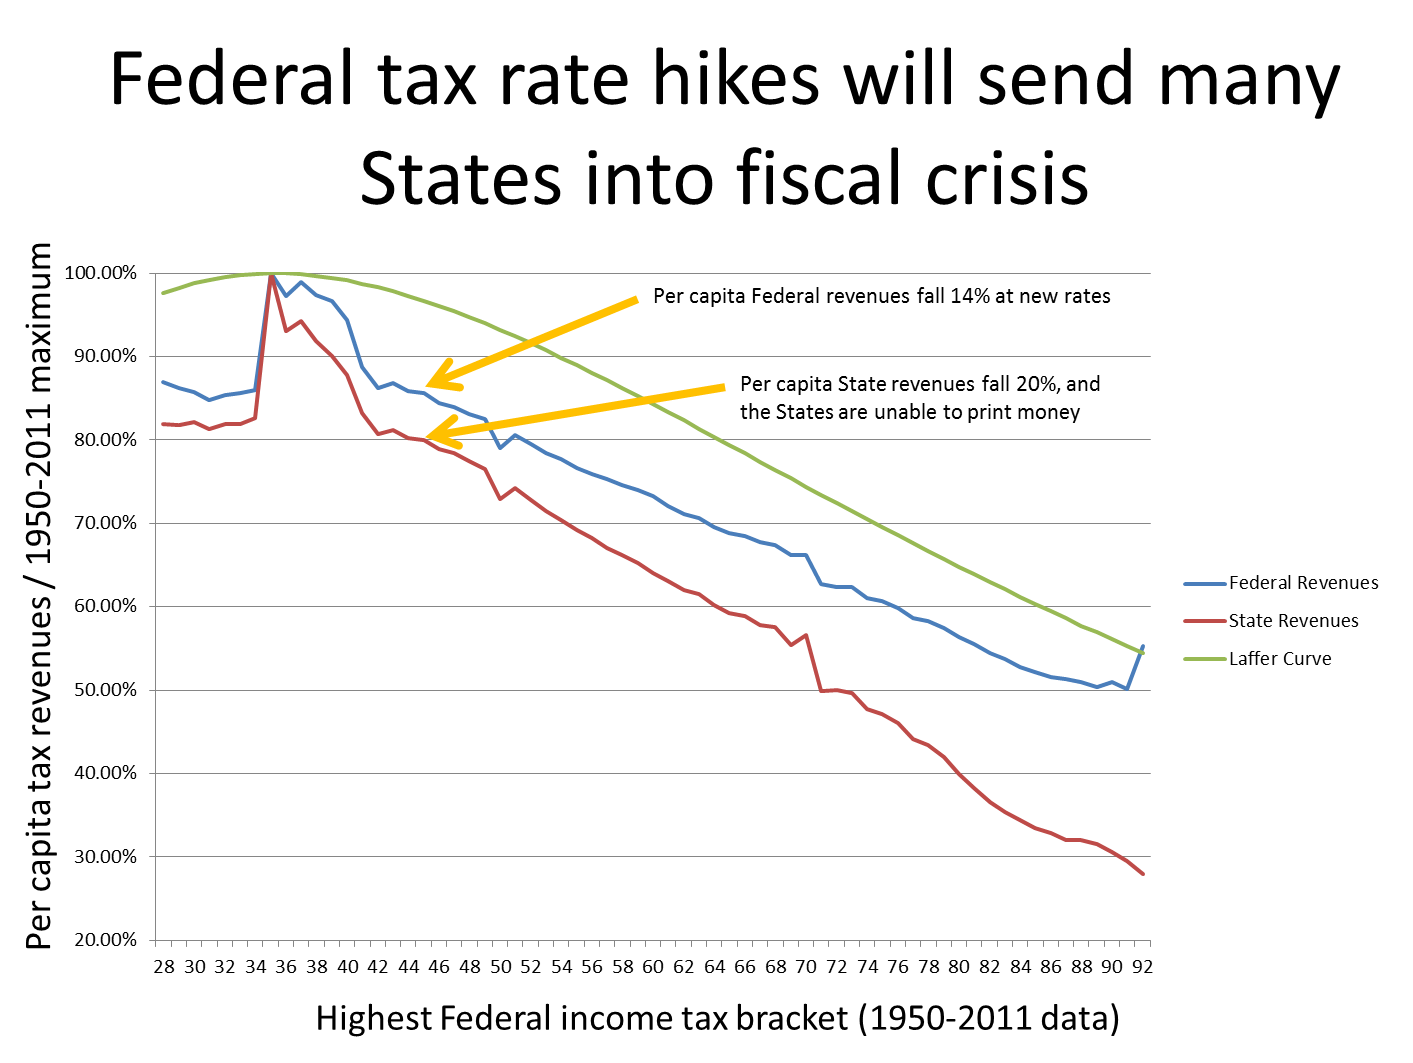
So far weve been looking at the effect of Federal tax rates on Federal revenues.
For some people its a hard sell even if you give them all the source data and invite them to figure out a way it doesnt fall as Ive demonstrated.
Now for something simpler: the states.
If the Federal government raises rates, what happens to STATE revenues?
Its not pretty:
source list: http://market-mousetrap.blogspot.com...urce-data.html
The true size of government isnt measured by how much of your life it can control, but in how many real dollars it can raise.
By reaching too far, our government will starve itself and the states from the very power it is trying to seize.
The states will respond by raising their own rates in a tax war with only one target: us.
The red line is a clearer picture of the economy as well, since it shows the raw effect of the Federal power grab.
Some states COULD, in theory, just ride it out. But as Nate Silver commented recently,
http://fivethirtyeight.blogs.nytimes...ment-spending/
states have their own unfunded liability problem, with pensions growing in size faster than the working population. On the total government spending chart Nate provides, we have now passed the critical threshold of 35% GNP.
Its mathematically impossible
http://market-mousetrap.blogspot.com...soak-rich.html
for a government to grow after it passes 35% of GNP. It can go all the way to 100% and it will get smaller in total wealth the entire way.
In theory, states can put up a good fight. Federal spending has risen to 25% of GNP and the states to 15%. That means that a state hike of 5% will only have the economic impact of a 3% hike for the Federal rates.
The bad news is that they have more to make up for. The Federal rate hike from 35% to 43.8% was a 20% rate hike. The states will get a 20% revenue cut. To make that up they will try to raise state taxes by 20% at first, which will further depress their economies and revenue by an additional 4%, which means that states will not be able to stop until after they have raised rates by more than 25%.
But the worst news for the states is that their wealth is more mobile than wealth under Federal jurisdiction. A person can leave one state for another without having to pay a penalty, and he wont continue to be taxed like an American living abroad would be taxed on the Federal level. The most vulnerable states typically the blue states will be far more damaged than less progressive red states.
The first cannon of a civil tax war has been fired.
Its not over by a long shot.
And were all in the crosshairs.
Tim
 Posting Permissions
- You may not post new threads
- You may not post replies
- You may not post attachments
- You may not edit your posts
Forum Rules


 Reply With Quote