-
AAPL
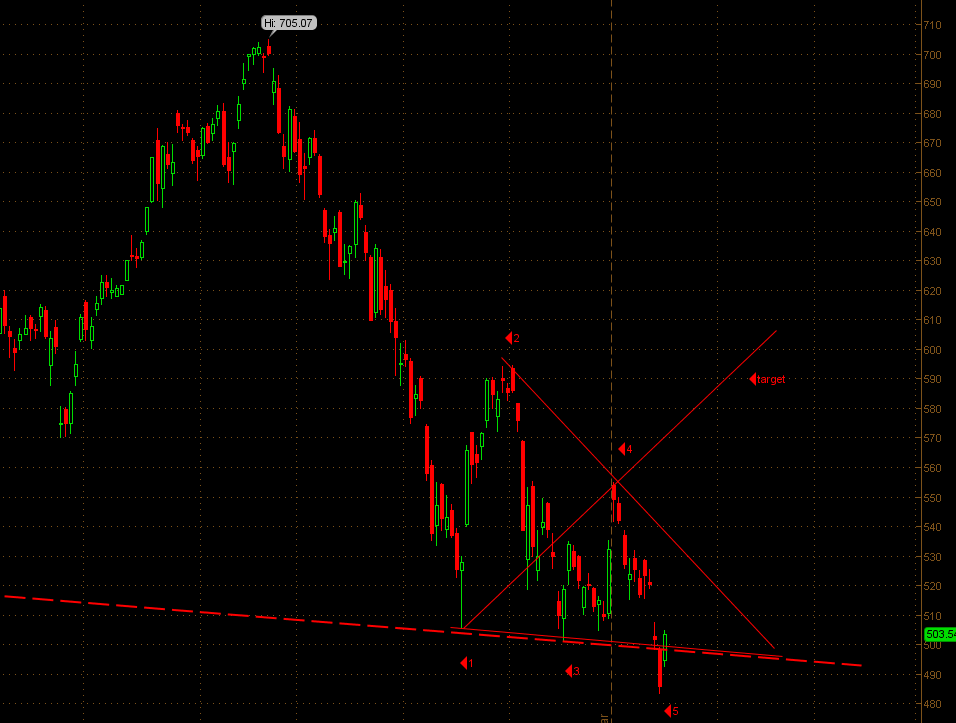
Thought I would propose a fun scenario with AAPL now that the neckline has been violated and the shorts are excited. a possible WW scenario could be in place to shake out the early shorts while building another shoulder in the H& S pattern. Target for the Wolfe wave looks like approximately the $600 level, in line with the upper boundary as well.
-
AAPL will start to move next week after options expiration on Jan 18
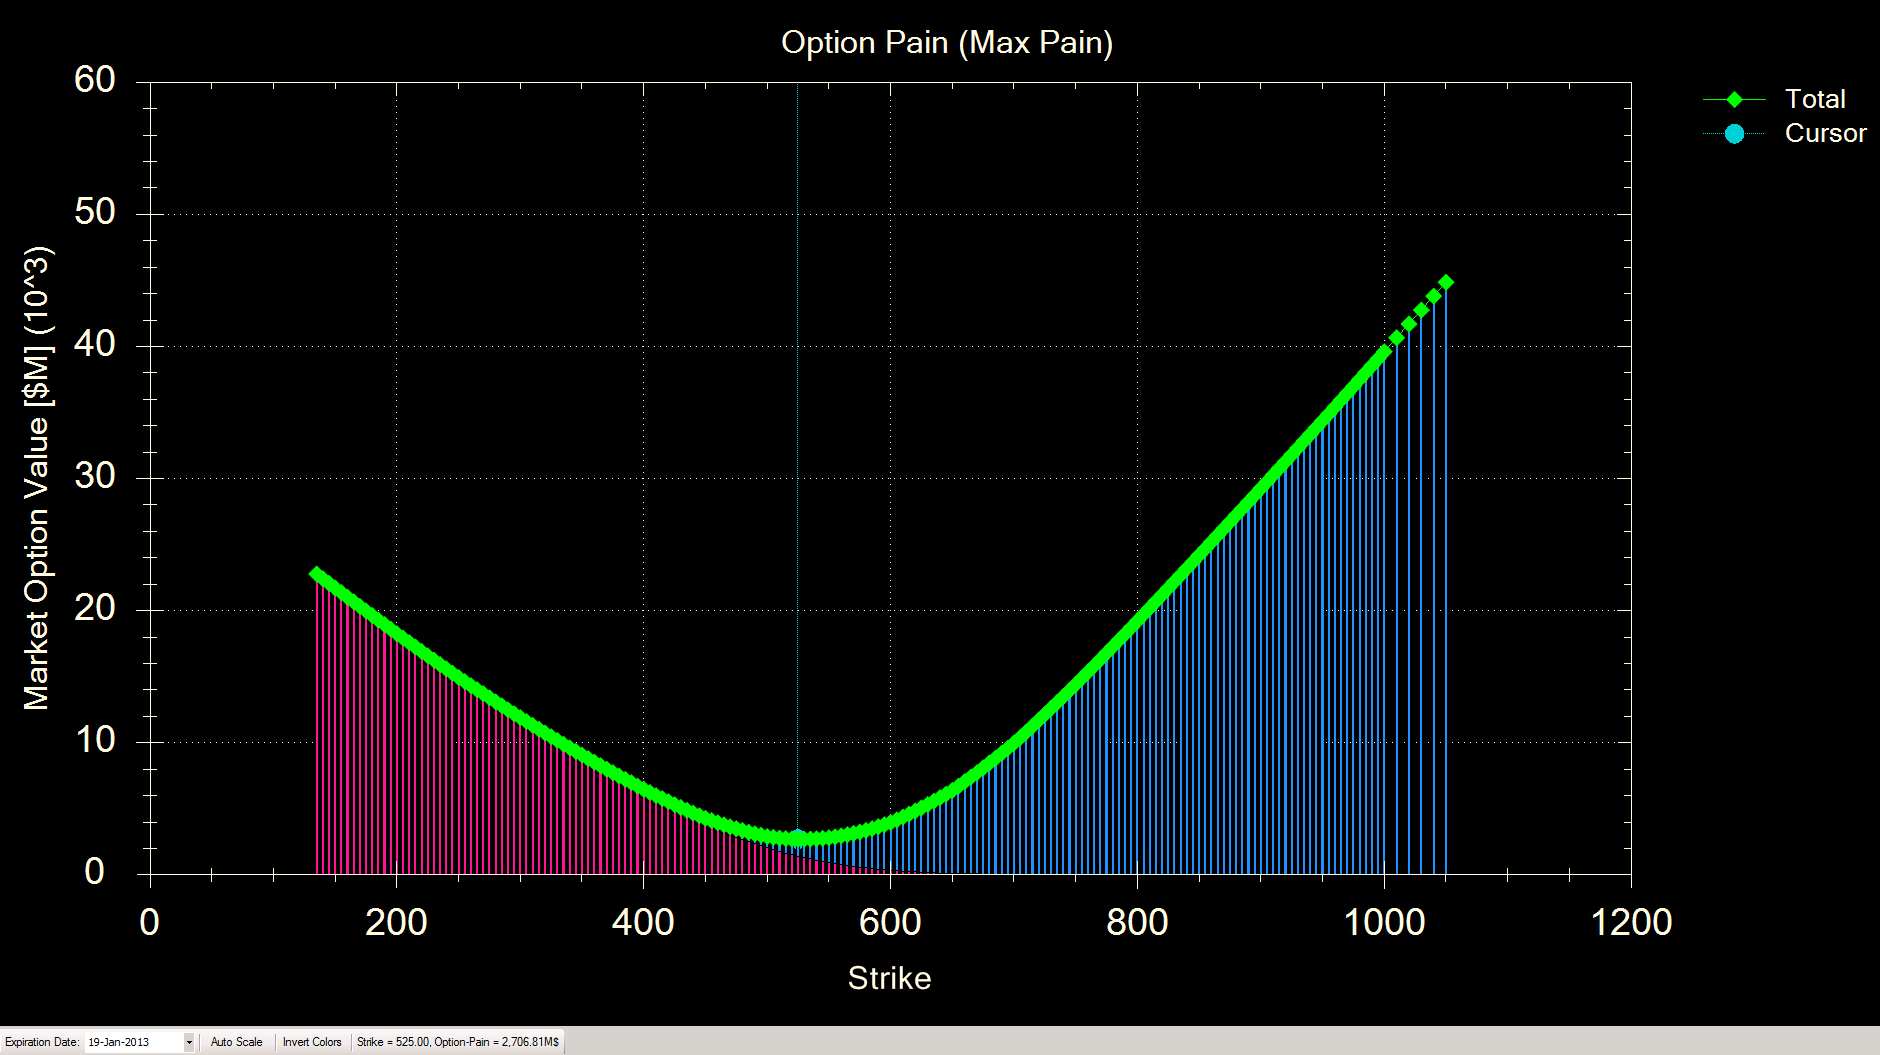
AAPL is in a narrow range until options expiration tomorrow. There are an abundance of long term options expiring and the Market Makers typically want to keep the price penned in so that the maximum number of Puts and Calls expire worthless. This is called the "Maximum Pain" level and for tomorrow it is around $500. Then next week, the market will start jockeying the price in anticipation of 4th Quarter earnings report on Jan. 23. I will be curious to follow the TEV and LEV on AAPL next week to see where the big boys are positioning themselves for the earnings report. AAPL is typically very conservative and consistently under-guides its revenue and earnings causing "surprises" that can rocket the stock up after hours. The few times they have not meet expectations, the stock has taken some nasty "bottom droppers".
Tom DeMark, the technical analysis guru, came out this week and called a bottom at $494 and says he anticipates a rally up to $600 (just like your graph estimates)....It will be a fun ride!
-
Max pain for AAPL as of close on 1/17:
Max Pain is presently $525, or 4.6% above today's closing price. Not an exact science, to be sure, but I would expect the price try to move higher and pin somewhere in the 510-520 strike.
Over the past 40d AAPL has a net 2,000K shares net accumulation while retail has distributed over 3,500K shares.
Past 20 days are not as optimistic, but still positive for LEV with the numbers at 500K net for LEV and -400 net for SEV.
Past 10d show that LEV is significantly below the waterline by 1800K shares while retail is positive 286K shares.
Last 5 Days show LEV starting to pick up while retail continues to dump.
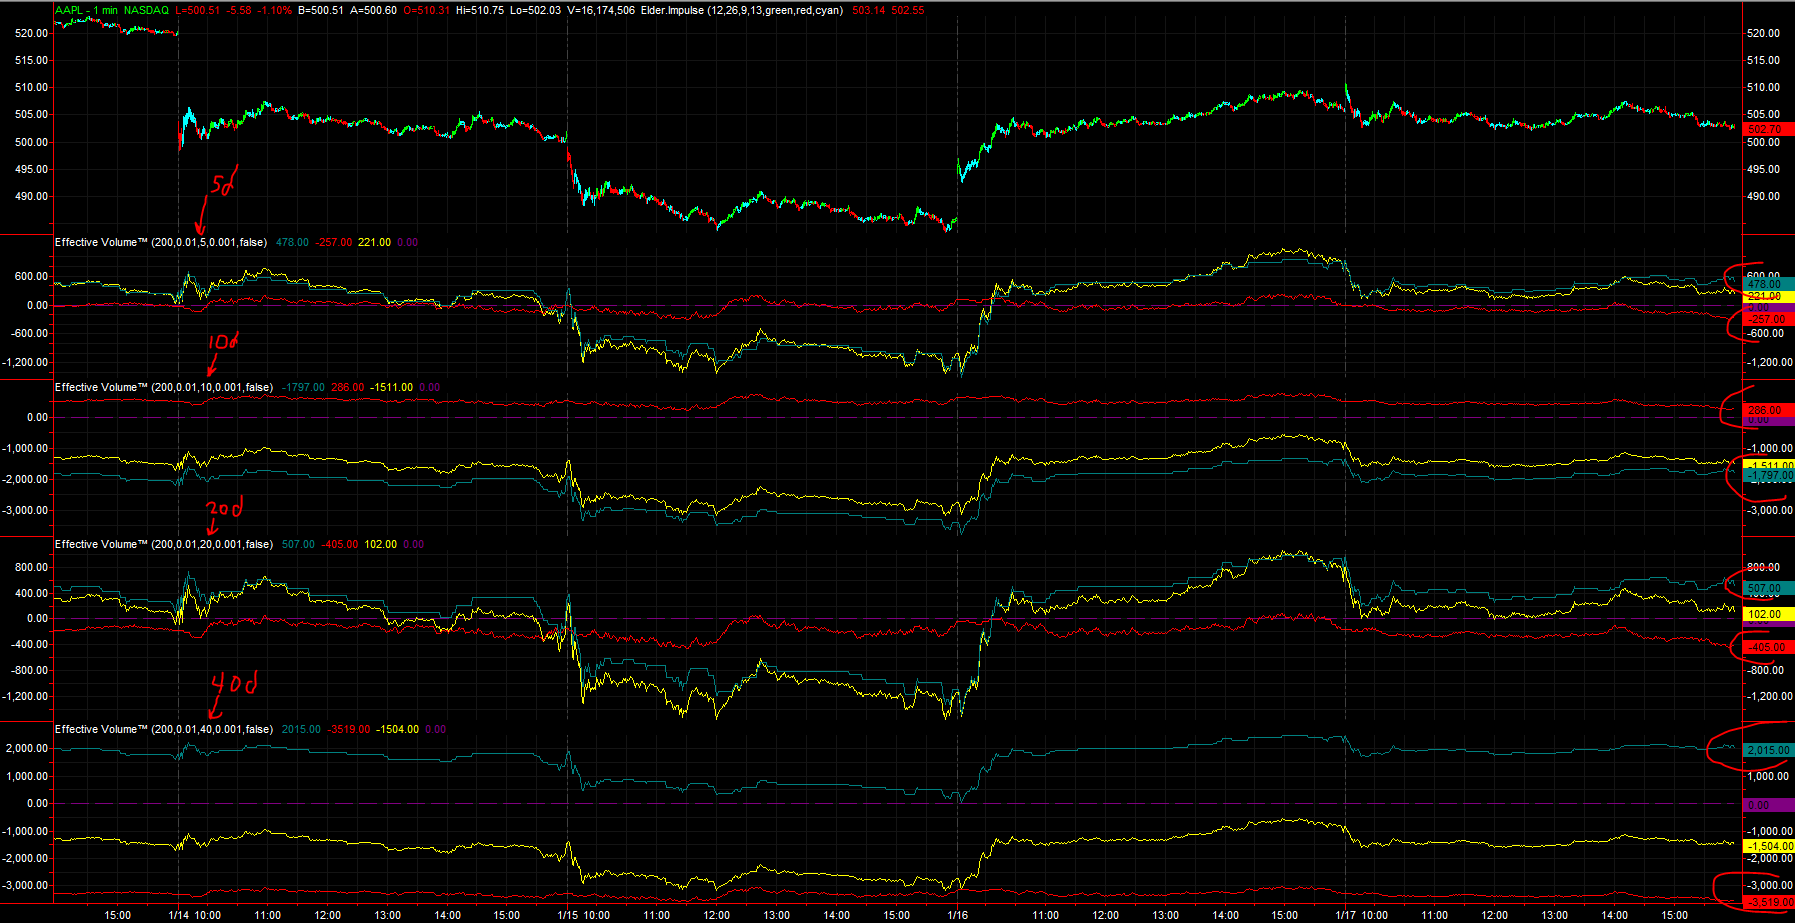
Classic case of the small/retail markets being out of sync with the "smart" institutional money. Classic.
Regards,
pgd
-
Looks like around a $500 close for AAPl options expiration
With just 35 minutes to go AAPL is at $498 and change....
Here's another article about AAPL closing history on optons expiration day.
http://www.minyanville.com/trading-a...als&from=yahoo
-
I was watching it throughout the day b/c I knew that it wasn't going to pin where max pain was the evening of the 17th.
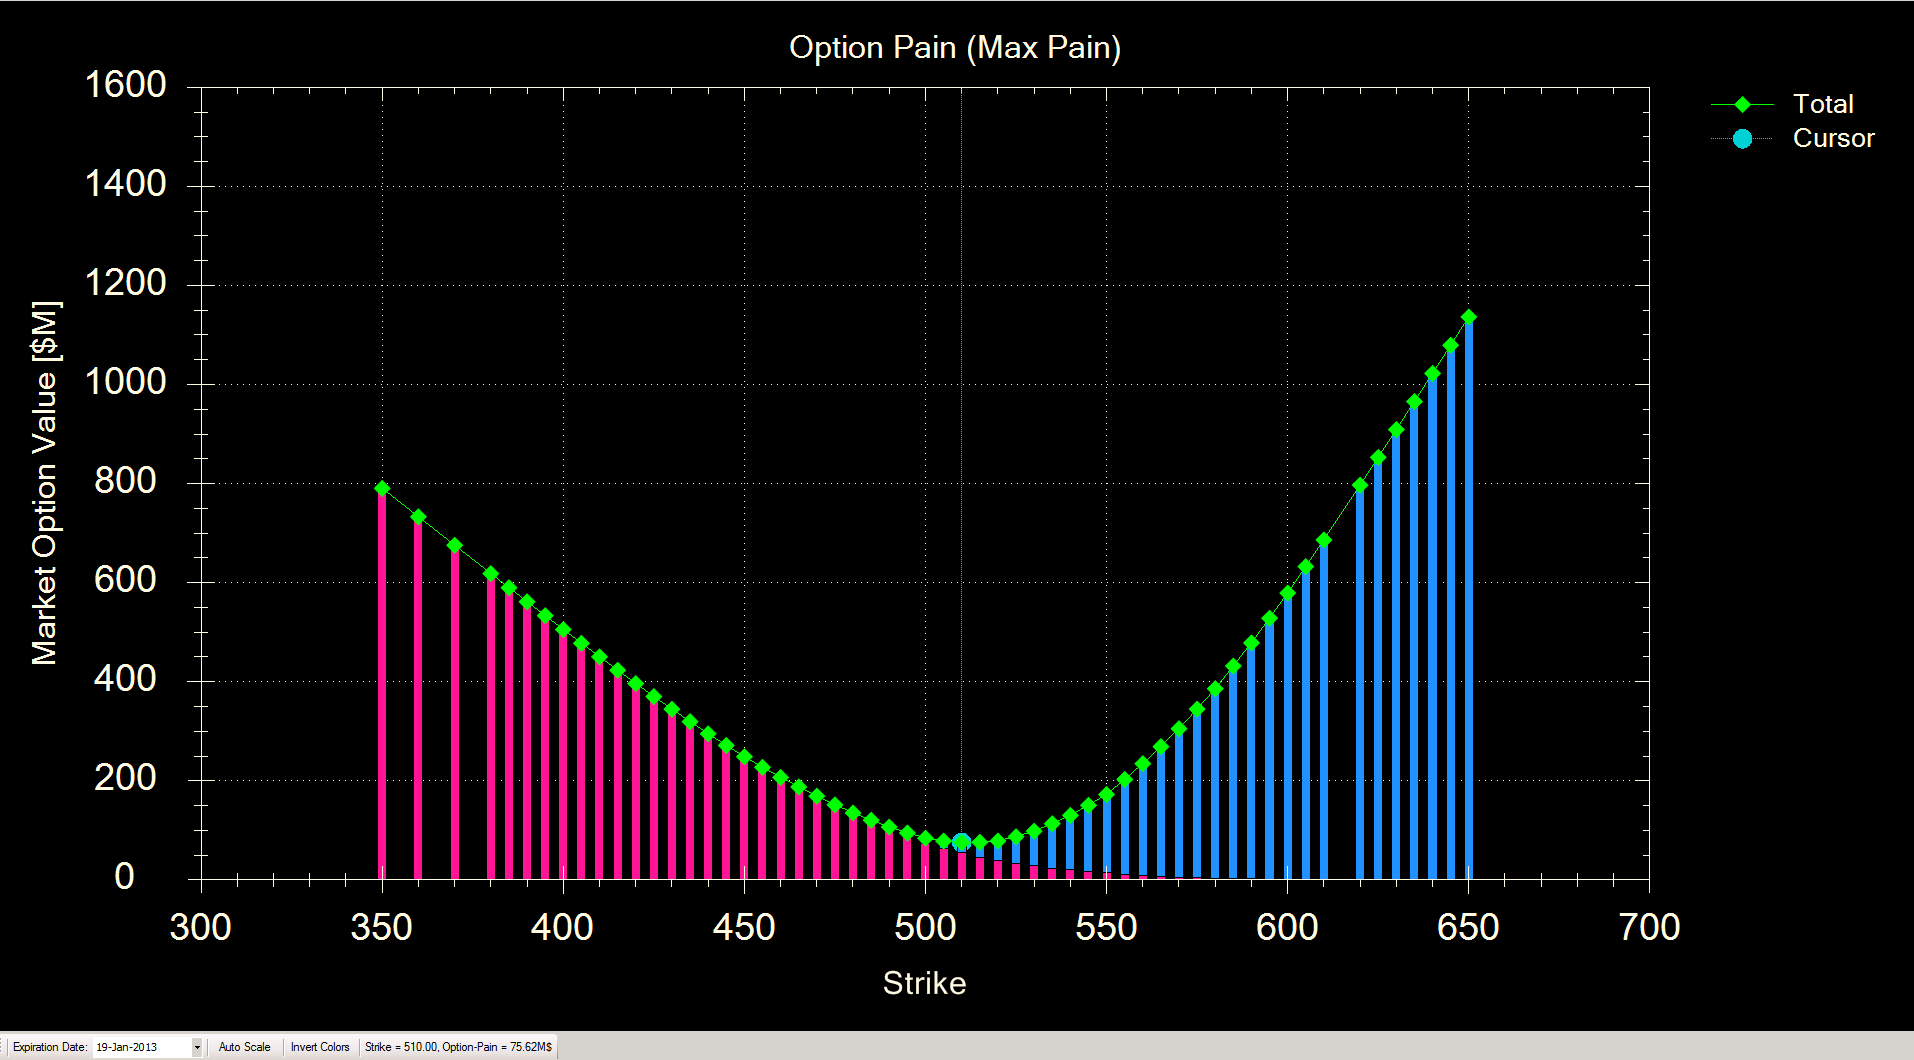
Here's a snapshot of the final max pain, according to yesterday's (Saturday's) settlement data. It appears max pain was $510.
Although I look at max pain when I look at optional stocks, I've never found a way to make it actionable in a way to make money. I'm interested in actionable ideas that can work with max pain.
My work to date has focused on weeklies -- I think weekly options tie nicely to max pain for the weeklies, but time decay certainly will nail you to the wall if you're wrong.
Interesting exercise.
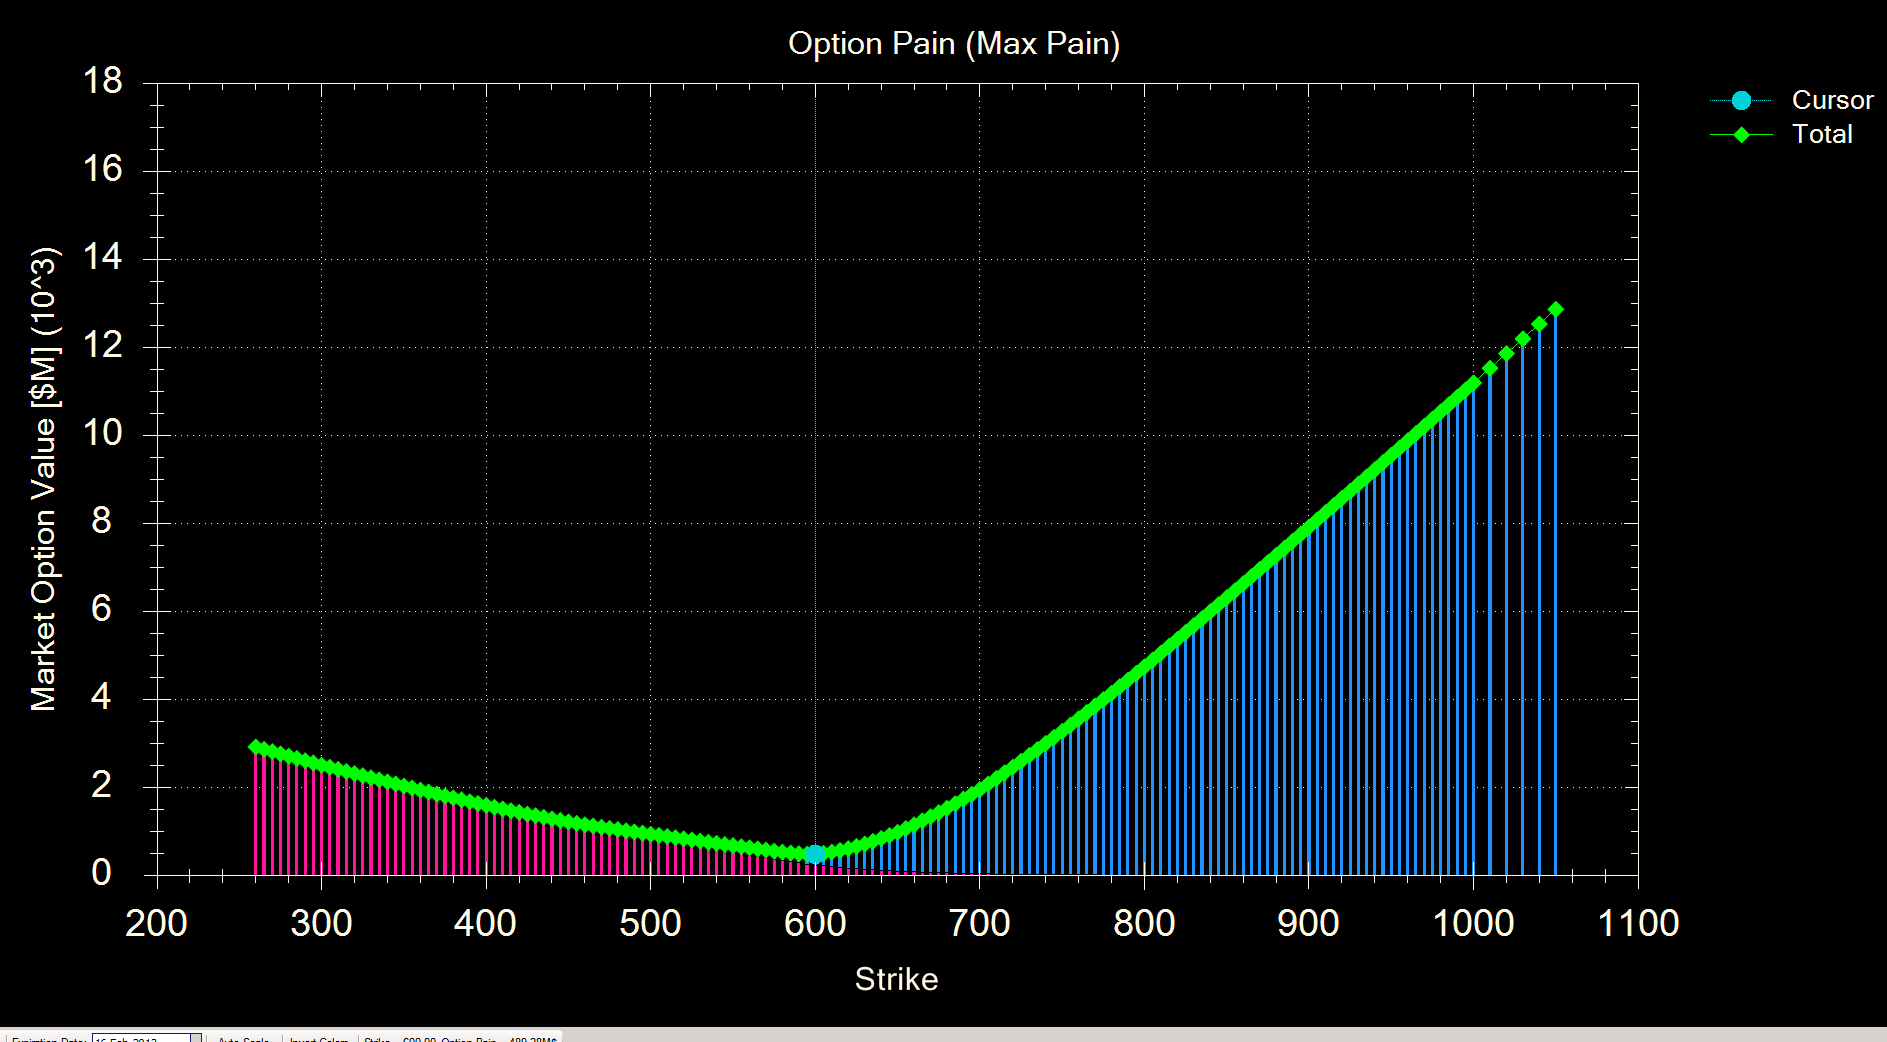
In the for what it's worth column, February expiration has max pain at $600:
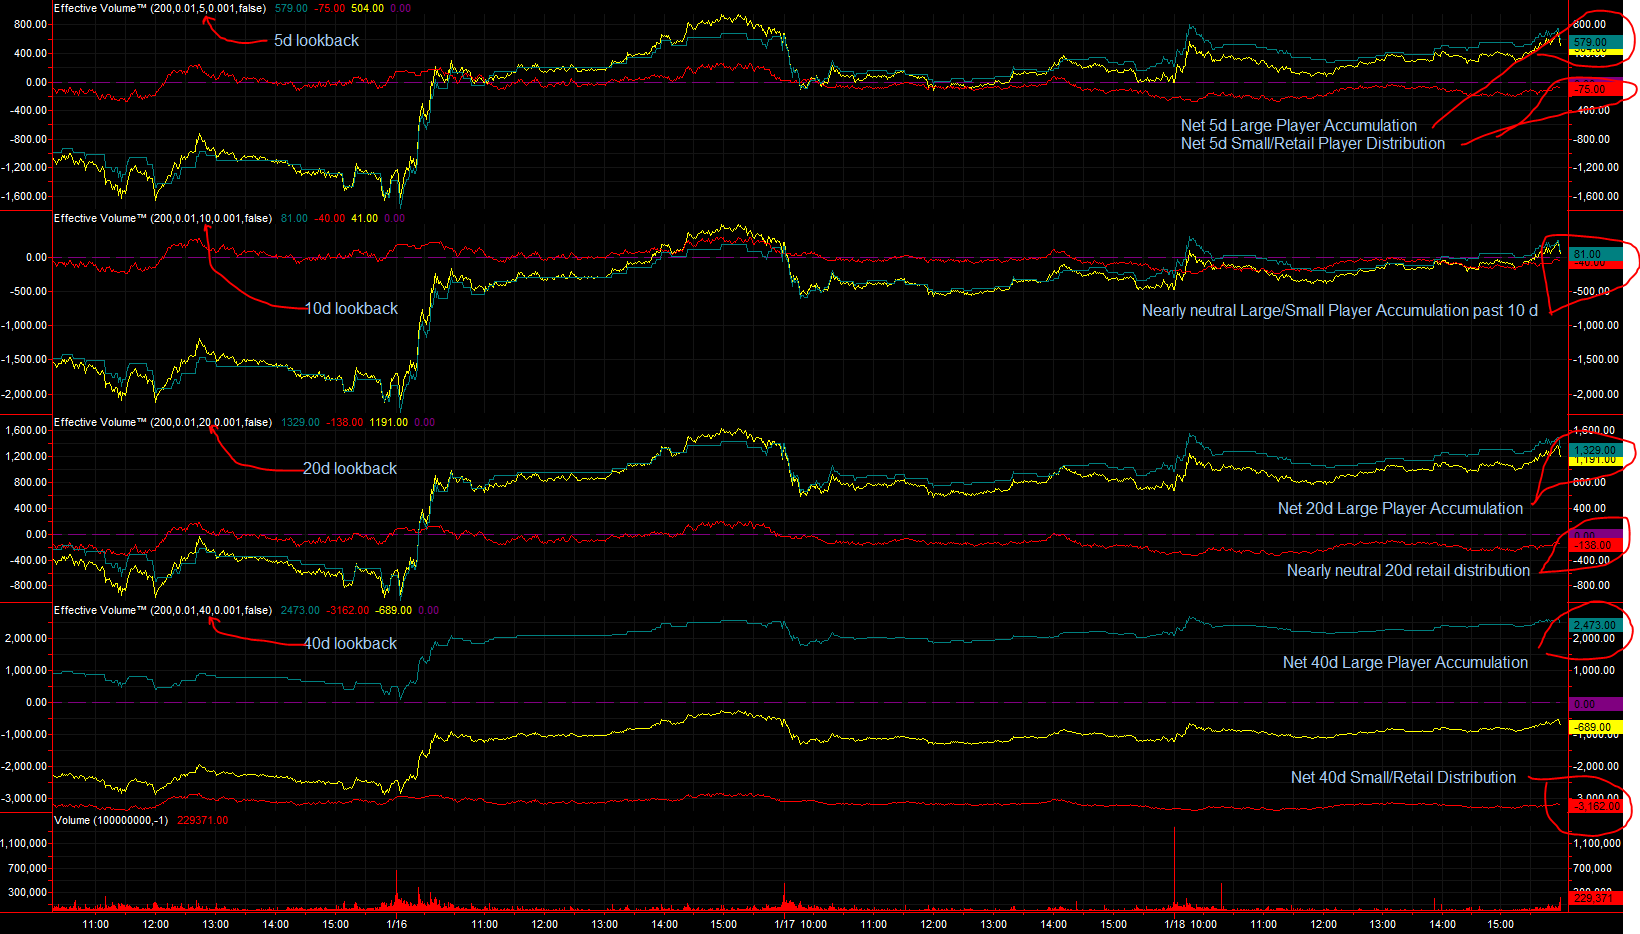
I think it important to watch multiple time frames on AAPL with EV:
Right-click any of these images to open in a new tab or window.
Here, I've got four EV presentations on AAPL: The top is a 5d lookback, e.g., the accumulators for LEV, SEV, and TEV are reset 5 days ago. Below that is a 10d, then below that is a 20d, and finally, below that, is a 40d.
On a 40d scale there have been buyers of AAPL with respect to LEV, while the retail/small investor has sold. In fact, the retail investor has sold more than what has been accumulated by the large player, so this is most likely an influence in the dropping prices over the past 40 days. AAPL has fallen -12.5% in the past 40 trading days.
On a 20d scale large players have been net accumulators while the retail world is nearly neutral (slight distribution. AAPL has fallen in price -5.5% over the past 20d while large players accumulate. Interesting.
On a 10d scale we're more/less at equilibrium around buying/selling. AAPL has dropped -5.9% over the past 10d.
On a 5d scale large players are stepping in while retail has continued to sell. AAPL has fallen -4.6% in the past 5d.
All price changes relative to their prices Xd ago.
Bottom line, I interpret this, in conjunction with options max pain for February at $600, as quite bullish. Whether we get to $600 is anybody's guess, but smart money (e.g. LEV) suggests accumulation is starting to pick back up at these prices and we are most likely headed higher in AAPL.
Remember, my crystal ball is as good as yours.
Regards,
pgd
 Posting Permissions
- You may not post new threads
- You may not post replies
- You may not post attachments
- You may not edit your posts
Forum Rules


 Reply With Quote
