+ Reply to Thread
Page 1 of 2 1 2 LastLast
Results 1 to 10 of 14

Thread: 1-16-2013 Comments

  1. #1
    Join Date
    Dec 1969
    Location
    Tarzana, CA
    Posts
    962

    1-16-2013 Comments

    So far we remain at a +4 exposure count (90% invested). We will get a B5 (living above the 21-day) signal any day that the NASDAQ closes up. I am more exposed than this at 120%. The stocks in my portfolio keep going up sucking me in further. This rally wasn't expected but I don't let my opinions get in the way of making money. I suspect it is the Fed printing press that has us moving up. The Fed may talk about ending QE but who would be left to buy the Treasury debt? I think the Fed may be trapped into QE infinity until we go the way of Greece.

    I am reading an interesting book on secular bear markets (Probable Outcomes, Secular Stock Market Insights by Ed Easterling). This book reports on the considerable reasearch conducted by Crestmont Research. Visiting their website exposes much of their data. The book is good. One conclusion that may be a bit depressing is that the current secular bear starting in 2000 may still be in the early stages and nowhere near an exit stage. The Fed may be able to "print" the market up but probably not in terms of purchasing power. The next secular bull market can begin after interest rates go up and then turn south. This could take another decade.

    One of O'Neil's portfolio managers reported something interesting this year. He made a major play in the housing sector starting in January of this year. His portfolio went up 300% by correctly timing this sector. These cyclical plays can be very profitable if you know how to time your entry and exits. With the possibility that we may see no net gain in the markets for a long time this cyclical play has my attention.

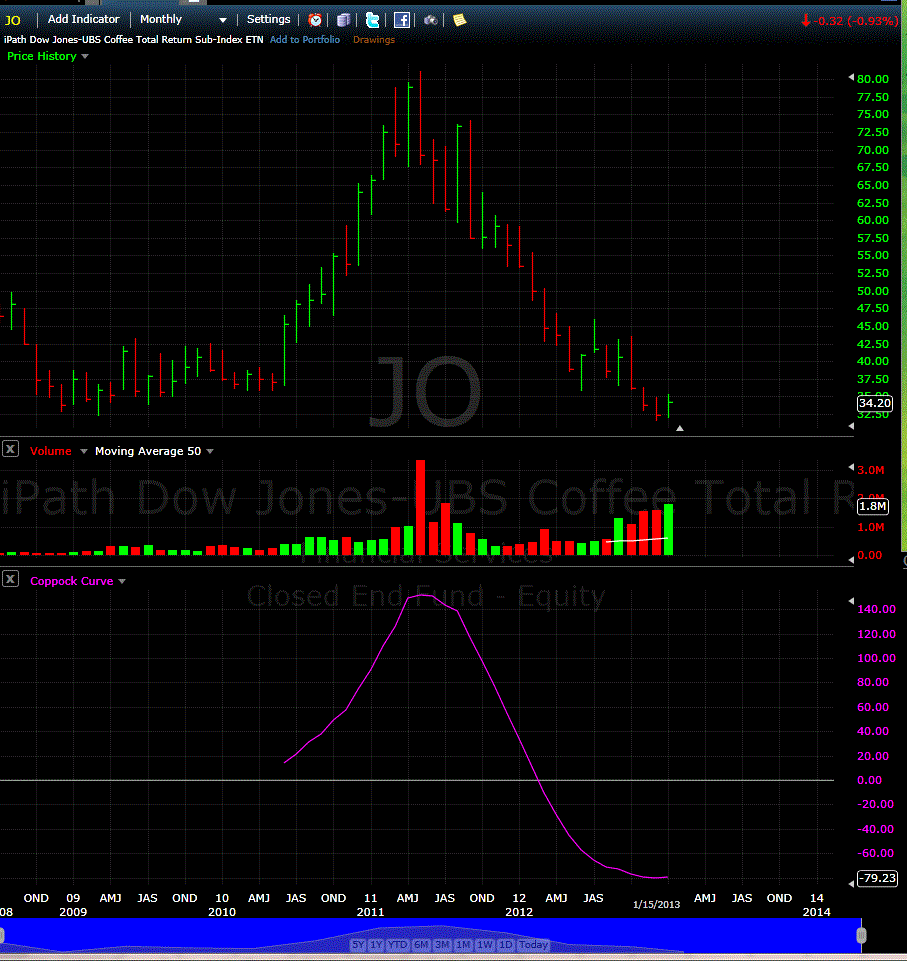
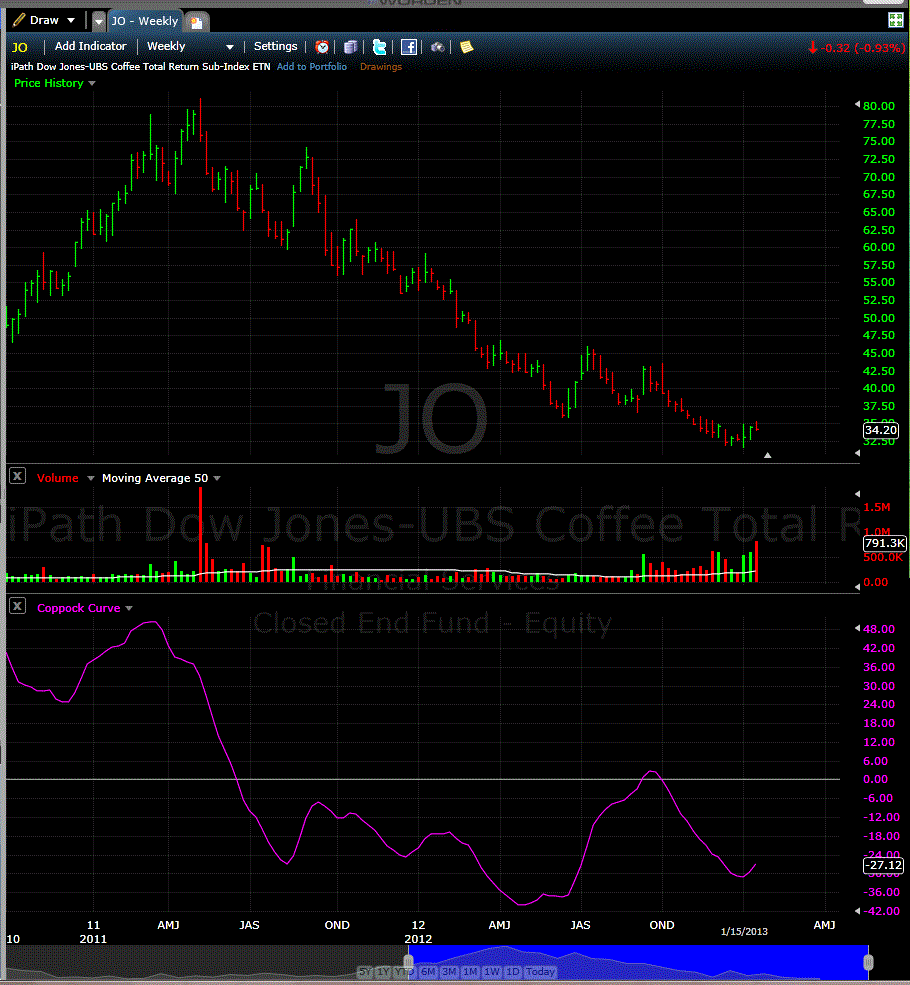
    In this regard I have been exploring a method for timing cyclical market entries using the Coppock indicator. You can google the term. We have been using the Coppock for quite some time on the general markets to confirm follow-through days with good success. Relative to a cyclical market take for example Coffee (ETF symbol JO) which looks like it has made a major bottom by inspecting the monthly Coppock. I am not entering a position but I am following this example as a possible model. The housing sector signaled a major buy signal in January of this year and would have allowed us to duplicate the 300% gain example above. This and the fact that the Coppock seems to work with Gold was the impetus to look into this approach.

    Anyone wishing to follow along can do so at freestockcharts.com because the Coppock is supported there.

    Below are two charts, the monthly and weekly JO charts showing the Coppock indicator on freestockcharts.com. A Coppock buy signal occurs when the value is negative forming a trough and just turning up. Gold (GLD) by the way is just about to signal a new weekly chart Coppock entry point. I may act on this.


    Name:  JO Monthly.GIF
Views: 421
Size:  71.2 KBName:  JO Weekly.GIF
Views: 446
Size:  71.1 KB
    Mike Scott
    Cloverdale, CA

  2. #2
    Mike; Are you using the FreeStockCharts default of 11-14-10 for the Coppock or what HGSI uses 14-10-10?
    Thank you.
    Robert

  3. #3
    Join Date
    Dec 1969
    Location
    Tarzana, CA
    Posts
    962
    Quote Originally Posted by brrim View Post
    Mike; Are you using the FreeStockCharts default of 11-14-10 for the Coppock or what HGSI uses 14-10-10?
    Thank you.
    Robert
    I use 11-14-10 as was originally set up by Edwin Coppock.
    Mike Scott
    Cloverdale, CA

  4. #4
    I searched online and here is a link to the TS code (download link is at the end):

    http://www.traderslaboratory.com/for...ock-curve.html

  5. #5
    Join Date
    Jan 1970
    Location
    Las Vegas, NV
    Posts
    172
    Hi Mike,

    Was the portfolio manager that you reference utilizing options to attain such a stellar performance in a matter of weeks, or was his entry into the housing sector in January of 2012? Really appreciate the comments on cyclical sectors.

    Best Regards,

    Eric

  6. #6
    Join Date
    Dec 1969
    Location
    Tarzana, CA
    Posts
    962
    Quote Originally Posted by ericoleman View Post
    Hi Mike,

    Was the portfolio manager that you reference utilizing options to attain such a stellar performance in a matter of weeks, or was his entry into the housing sector in January of 2012? Really appreciate the comments on cyclical sectors.

    Best Regards,

    Eric
    I don't know for sure but I don't think so as he has never mentioned playing options at any time in the past. He is a margin player for sure and a very good swing trader. He analyzed the group and picked the four stocks that had gone down the most and played these. He entered around Jan 6 of 2012.
    Mike Scott
    Cloverdale, CA

  7. #7
    Join Date
    Dec 1969
    Location
    New Jersey
    Posts
    189
    Hi Mike,

    Regarding the coffee example, do you think it is better to analyze the futures or the ETF to generate the entry signal for coffee using Coppock - understanding one would enter a position using the ETF?

    Regards,
    Harry

  8. #8
    Join Date
    Dec 1969
    Location
    Tarzana, CA
    Posts
    962
    Quote Originally Posted by Harry View Post
    Hi Mike,

    Regarding the coffee example, do you think it is better to analyze the futures or the ETF to generate the entry signal for coffee using Coppock - understanding one would enter a position using the ETF?

    Regards,
    Harry
    Harry, I suspect that it would be better to time signals off of the futures contract when buying a commodites etf. I just checked and am seeing the same signal. I attach an image below of the monthly interval chart of coffee futures. I don't intend to trade this signal but am interested in the setup and will look for more setups like this for better testing. In looking back at prior signals on coffee many work, some don't. In the image the far left signal in 1998 didn't work at least not for long. There are five+ coppock buy signals on this chart. in the 2009 signal there is a wiggle that probably comprises two signals, same thing with the repeat 1998 signal in 1999. In the procedure developed for confirming follow-through days on the equity major indices the monthly is monitored for a trough development in the negative half plane (signifies a cyclical bear market shifting to a bull market) and then shift focus to the weekly chart for a fine tuned signal. A monthly chart is a blunt instrument. In the equity market we then look for a follow-through day to be confirmed by the coppock signal in the near vacinity. Plus or minus 4 weeks is a confirmation that shows much improved odds of a tradable rally vs. nonconfirmation. For something like trading coffee or gold a trade trigger is needed which needs some study. Possibly a pocket pivot or base breakout or moving average bounce or all of these.

    Name:  Coffee Monthly.GIF
Views: 310
Size:  358.3 KB
    Mike Scott
    Cloverdale, CA

  9. #9
    Join Date
    Dec 1969
    Location
    New Jersey
    Posts
    189
    Mike,

    Thank you for the very detailed response! I look forward to re-reading tonight and properly digesting.

    Harry

  10. #10
    Join Date
    Dec 1969
    Location
    New Jersey
    Posts
    189
    Hi Mike,

    When you get a free moment, curious if you would update us on your thoughts regarding gold and the recent Coppock signal?

    Best Regards,
    Harry

+ Reply to Thread

Posting Permissions

  • You may not post new threads
  • You may not post replies
  • You may not post attachments
  • You may not edit your posts