-
01/10/2013 Mousetrap: Calculating the true Laffer Curve
From: http://market-mousetrap.blogspot.com...fer-curve.html
According to Art Laffer, a tax rate of 0% would raise 0 dollars in revenue, and a tax rate of 100% would also raise 0 dollars in revenue. The optimal tax rate would be somewhere between 0% and 100%, and there is a wide range of opinion between Liberals and Conservatives about where that maximum revenue point would be.
But we arent at the mercy of opinion, because we have data.
Last night I posted a rough graph derived from 1940 to 2011 income tax data. Tonight Id like to fine tune that data a bit to give a clearer (and most surprising) view.
The original graph only used time periods of 5 year, 10 year, 20 year, and 30 year increments, and did not accurately average each specific tax percentage rate.
For the corrected graph Ive taken ALL time periods, from 1 year, 2 year average, all the way to 72 year average rates and returns. All of the values are equivalent to 2005 dollars, and divided by the U.S. population for that year to give per capita revenues in equal weighted currency.
That gave me 2,628 percentage rate and per capita return rows.
Next, I rounded each percentage fraction to its nearest full percent (i.e. 29.9% and 30.1% would both be 30%).
Next, I averaged all per capita return values for each full percent between 28% and 94%. (There is no income tax data outside of those percentages for the 1940 to 2011 time period).
Finally, I divided each percentiles return rate by the maximum potential return, which was located at 35%. So, the return for 35% is 1. The return for 44% is 0.8581.
I did the same thing for the idealized capital gains curve created for my 11/17/2012 post:
http://market-mousetrap.blogspot.com...soak-rich.html
The two curves are now on the same scale:
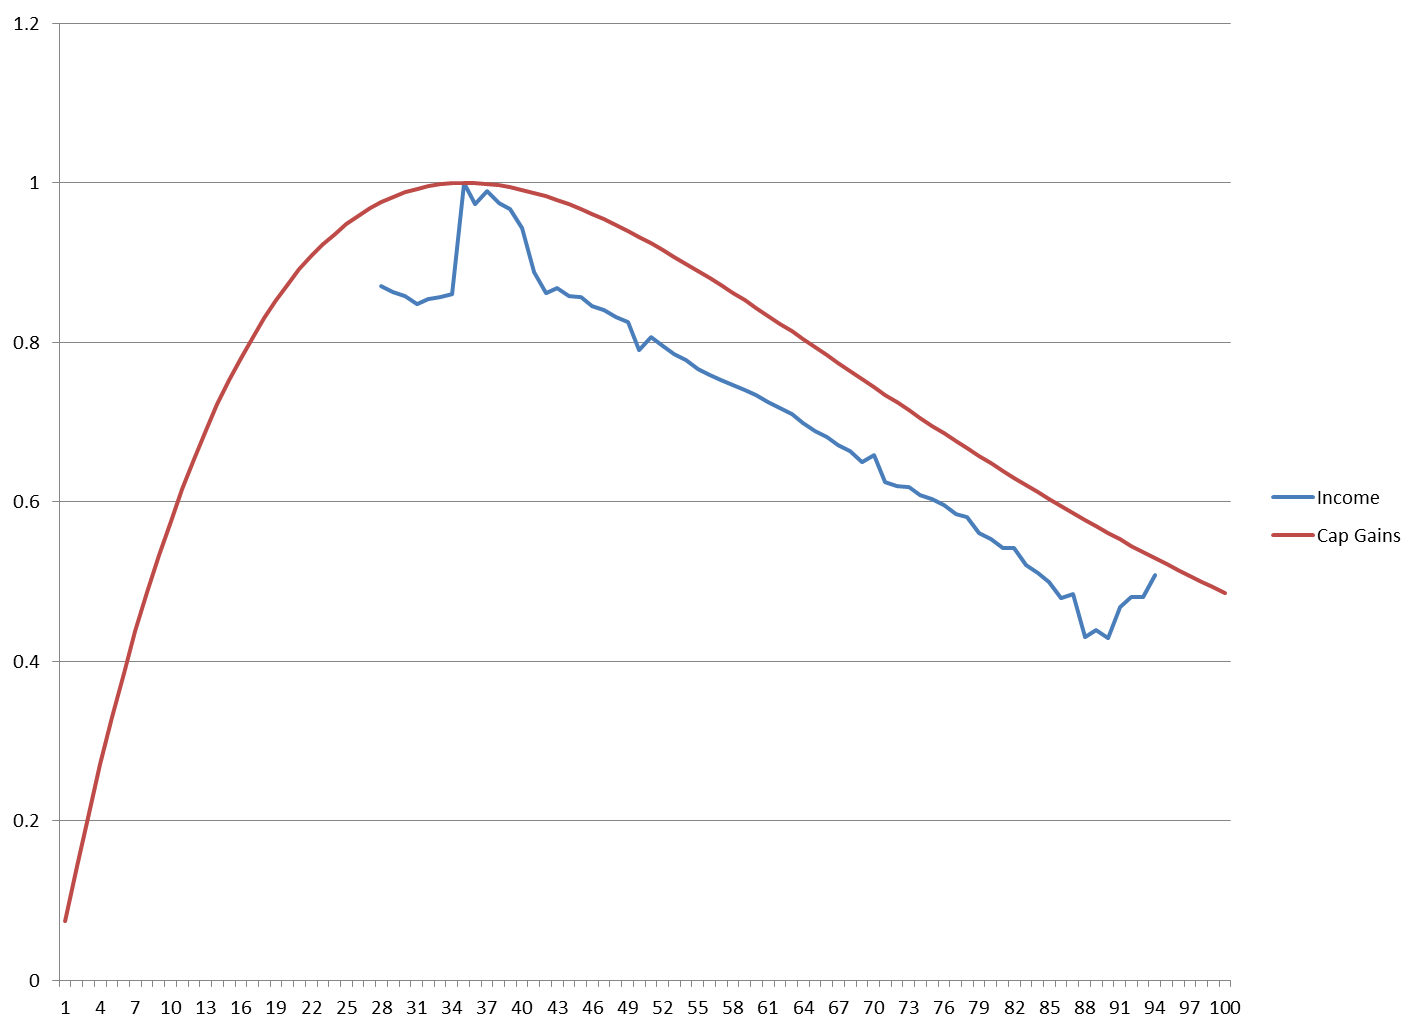
The blue line is the historical revenue curve for Income Taxes.
The red line is the idealized revenue curve for Capital Gains.
The blue line was calculated from 72 years of data (1940-2011) maximum income tax rates for each year; total Federal revenues for each year, divided by total U.S. population for each year.
The red line was calculated from 62 years of the S&P index (full details are on the 11/17/2012 post).
Both lines show maximum revenue at a 35% tax rate but that should NOT be true if Art Laffer were correct. Look more closely at the right side of that curve. The idealized red curve shows capital gains revenue even if government taxed 100% of your capital gains. According to Art Laffer, the government should get 0 dollars in revenue at a 100% tax rate, but the idealized line assumes no change in investor behavior and terminates with 48.54% of the revenue that would have been generated at a 35% rate. That is, if a 35% rate would raise $10,000 in revenue, a 100% rate would STILL get $4,854 in revenue.
Of course, thats absurd, right?
Well, no look at the blue line. The blue line shows ACTUAL government revenues between 28% and 94% top income tax rates. The curves have the same slope!
This is astonishing to me. The Laffer Curve seemed to be intuitive, but it turns out to be wrong. People will still work even as the tax rate approaches 100%, and in fact this is what we have seen in communist groups such as the old Soviet Union, or even a social commune like an Israeli Kibbutz. There are various reasons to work: boredom, dissatisfaction with environment, peer pressure, government mandates to work-or-else, etc.
So, it turns out that Conservatives are wrong: tax rates do NOT directly influence individual behavior.
And yet the revenues go down anyway
This is where the Liberals are wrong: tax rates DO affect total economic activity.
The reason is rather mundane: people are still willing to work, but they run out of things to work with.
We dont get taxed once, but in incremental layers. When I buy a car or groceries, thats in AFTER TAX money. My car dealer and grocery store clerk take MY after tax money and then have to pay tax on what THEY get, and then THEY buy things with whatever is left over after their taxes.
The higher the tax rates, the less layers of activity there are before everyone runs out of money. I may be able to buy a car and groceries, but my grocer may not have enough left to buy a car himself. So, the grocer will STILL work (as the Liberals say), but he wont have enough left over to pay for anything (as the Conservatives say). The limit isnt necessarily in terms of human labor, but instead in raw materials.
Communist countries produced cars, made out of what scanty materials they could buy, and so the cars were practically worthless. A farmer may be willing to sow, if there were any seed left to buy.
The metal and the seed ended up in the non-Communist countries that could pay more. Even though a person MIGHT work even if he werent paid, hell still sell to the highest bidder which is the buyer who hasnt already lost his money to taxes.
Take the money away, then, and economic activity slows down, in SPITE of individual behavior. People work harder and harder to buy less and less, until there is nothing left to buy.
In any case, according to this curve, the recent tax hike from 35% to 43.8% should create a 14% per capita DROP in Federal revenue.
Never trust a lawyer with math.
-
Good analysis. I need to digest more, but I like the approach.
Regards,
pgd
 Posting Permissions
- You may not post new threads
- You may not post replies
- You may not post attachments
- You may not edit your posts
Forum Rules


 Reply With Quote