-
Performance Graphs for 2012
Performance Graphs for 2012
From: http://market-mousetrap.blogspot.com...-for-2012.html
The year 2012 included a number of developments for the Full Mousetrap model, while the Sector model outperformed:
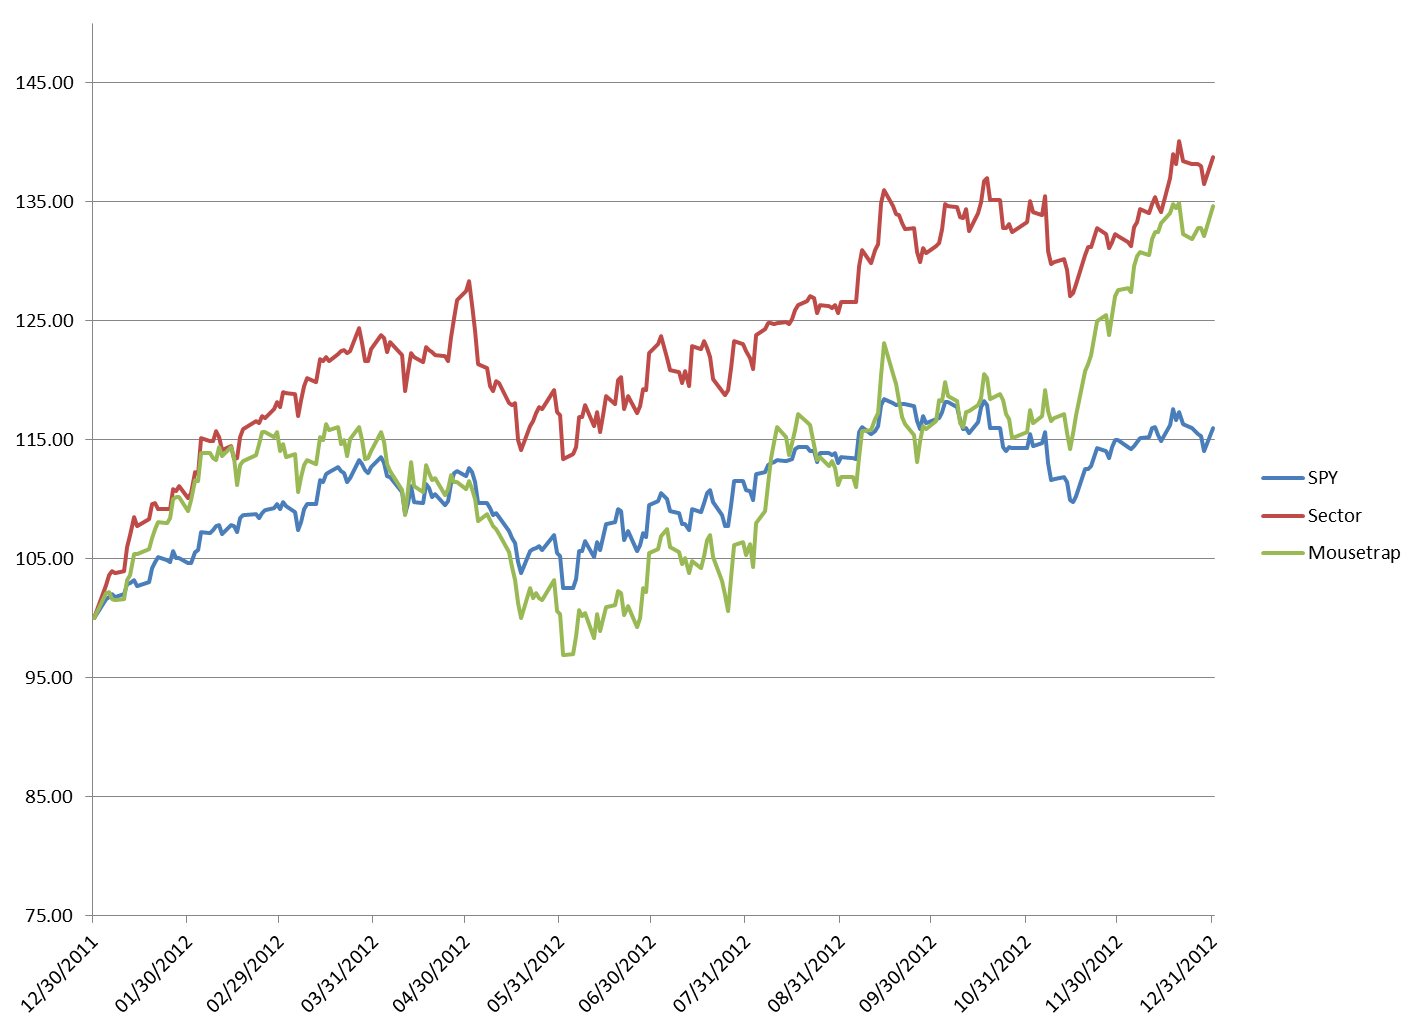
Ive started each line with a value of 100, so that the percentages can be easily seen between SPY, the Sector model, and the Full Mousetrap.
The actual numbers for 2012 are:
SPY 15.99%
Sector 38.75%
Mousetrap 34.60%
For the entire 5/31/2011 through 12/31/2012 period, however, the Full Mousetrap outperformed:
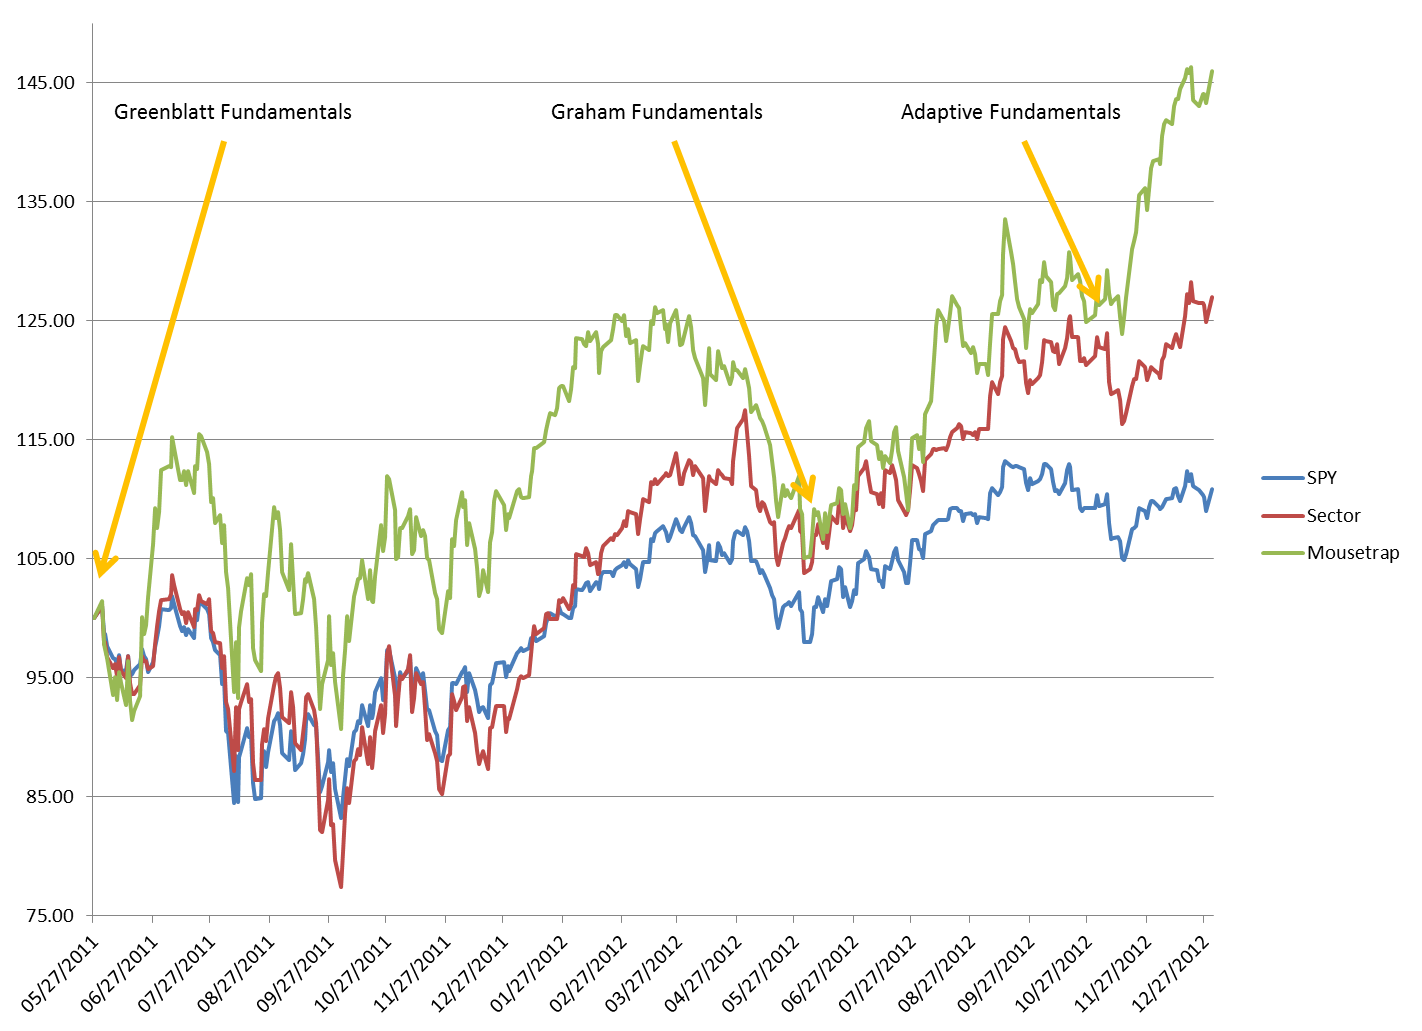
The actual numbers for the entire period are:
SPY 10.83%
Sector 27.01%
Mousetrap 45.99%
Ive also pointed out on this graph the changes in the fundamental filters I used in the Full Mousetrap. For the first year it labored under a Greenblatt filter that did not work well with the technical aspects of the model.
On 6/15/2012 I changed to a more robust Graham style filter, which created a significant improvement.
(Both the Greenblatt and Graham filters are defined on www.validea.com, which I used as a benchmark in early testing).
Finally, on 10/31/2012 I initiated a self-adaptive fundamental filter to progressively fine tune the fundamentals that work best with the model, and it appears to be working better than the two previous static filters. Hopefully that trend will continue.
Last edited by Timothy Clontz; 01-02-2013 at 09:08 PM.
Reason: typo
 Posting Permissions
- You may not post new threads
- You may not post replies
- You may not post attachments
- You may not edit your posts
Forum Rules


 Reply With Quote