-
Gold "Take-Down" analysis
I performed an analysis of similar take down of gold in the past few years, since June 2008.
The selling strength of the past few days is one of the strongest.
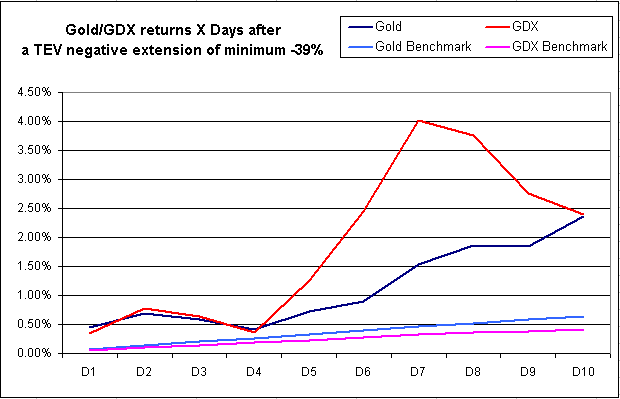
I recorded 20 such events and the Figure below shows the average returns of Gold and GDX if you buy a the close of such a day (today is such a day).
The benchmark is defined as the average return for one day, two days, etc, independently of the selling/buying strength.
This figure shows that after 10 days, the returns are much better than the benchmark, but also that after a "take-down", gold stays in a trading range for three to four days, before bouncing.
I will post a more complete study on the subject in tomorrow's daily comment.
Pascal

-
DeMark Perspective on Gold
Interesting, Pascal. From a daily DeMark point of view, we will be completing a 9-13-9 sell exhaustion pattern within a couple of trading days on cash Gold. That matches well with what your study shows in terms of a timing bottom.
 Posting Permissions
- You may not post new threads
- You may not post replies
- You may not post attachments
- You may not edit your posts
Forum Rules


 Reply With Quote