Dear Tim,Originally Posted by Timothy Clontz

Let me first thank you for your fantastic posts! They are really stimulating the mind.
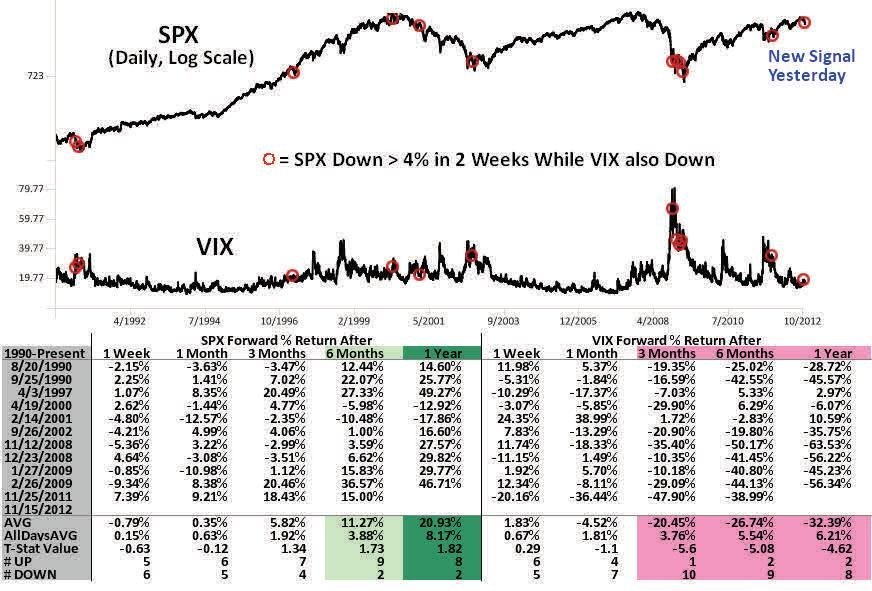
The comparison between SPX in 2006 and SPX in 2012 does not show a very similar pattern but the VIX does and it underlines my point.
In both years, SPX rose from January to April/May, then experienced a correction bottoming in June. The similarity ends here because SPX rallied up relentlessly until year-end in 2006 while it is in deep correction since September 2012.
So the VIX pattern trending lower from June to December in 2006 was a normal one during a sustained market rally while the almost identical pattern in 2012 is not normal during a correction. As Dave Landry wrote this morning in his newsletter : The Vix, which measures fear and complacency, didn't even wake up on the last leg down. I don't look at the Vix every day, but when I do, I have a Dos Equis. Seriously, the Vix only matters when it matters. And now, I think is one of those times.
On a side note, notice that the CBOE implied correlation index does also exhibit a very strange resilience to jumping higher in the current correction. Deducting from the maths usesd in the making of that index, currently, hedge funds do not use options strategies to protect themselves from a general market freefall but only for about half of the SPX stocks. This is unprecedented too since 2009 and could mean that they have already unloaded half of their long term positions (AAPL comes to mind). I think that I am just using basic logic here and you dont need to be an expert on the VIX or correlation to reach the same conclusions.
Billy
 Reply With Quote