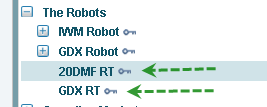
The new 20DMF is available here.
http://www.effectivevolume.com/conte...1068-real-time
The main changes are the explanatory messages and the fact that the short signals are now confirmed by the Cumulative ticks instead of the inversed ETFs.
Pascal

The new 20DMF is available here.
http://www.effectivevolume.com/conte...1068-real-time
The main changes are the explanatory messages and the fact that the short signals are now confirmed by the Cumulative ticks instead of the inversed ETFs.
Pascal

We get the raw data from our data supplier and calculate the Cumulative Tick and its average.
Pascal
I do not use TS. So I cannot comment.
However, we can note that the Cumulative Tick has had moves similar to IWM, which follows 2000 small size stocks.
IWM has been reluctant to go down.
Pascal
Pascal,
I do not want to belabour this point but it may be important in the long term.
I watch the following Tick Charts on Tradestation :-
$TIKRL = Russell 2000 Tick
$TICK1 = NYSE Tick
$TIKUSC = All US Tick Comp
At this moment in time all the 600 minute (xaverage(cum(c). 600) averages are trending down. Your RT graphed 600 min Average Cumalative Tick is trending up.
Something is obviously wrong . How sure are you that your data provider is correct ? (I am not saying my figures are correct but I think this observation needs checking as this is an imprtant element of the new 20 DMF RT).
Trev
$TIKQ and $TIKUSC 600min is moving up this morning (on TS) if you use average instead of xaverage. I find Pascal's cum tick is a lot similar to $TIKUSC than to $TICK based on last couple of days' chart.
PS, I tried both average and xaverage, seems the difference is very similar and charts look similar
Last edited by Wei; 10-31-2012 at 02:54 PM.
Yes. The system froze when it issued the short signal.
I think that this is a Java bug.
We are working on it.
Pascal
Pascal,
The current message states "buy when OBOS crosses over 30".
Shouldn't that be -30?
I understand the issue.
It is more probably due to data sampling of one minute compared to faster data sampling that TS uses.
We use one minute mainly because it is the only format that allows access to 5 years of back data... and we need to use the same data on the system that was used for the backtest.
In other words, we could display a CTick similar to Tradestation, but then it could not be comparable to what was used in the back-test.
I will come back to this discussion on Monday next week, as I am abroad now with limited resources in terms of time and calculation power.
Pascal