+ Reply to Thread
Results 1 to 4 of 4

Thread: 9-17-2012 Comments

  1. #1
    Join Date
    Dec 1969
    Location
    Tarzana, CA
    Posts
    962

    9-17-2012 Comments

    I don't know if it means anything that few canslimers can find anything to put on a watch list right now, but that is the situation. Everything that has been buyable is extended now. This may mean the market needs some breathing room on the short term. The market exposure model has been fully invested since August 6 and has just stayed there. We did see a stall day on the S&P500 on Friday raising the distribution count to 2 on that index. The last distribution day (stall day) on the NASDAQ was three weeks ago.

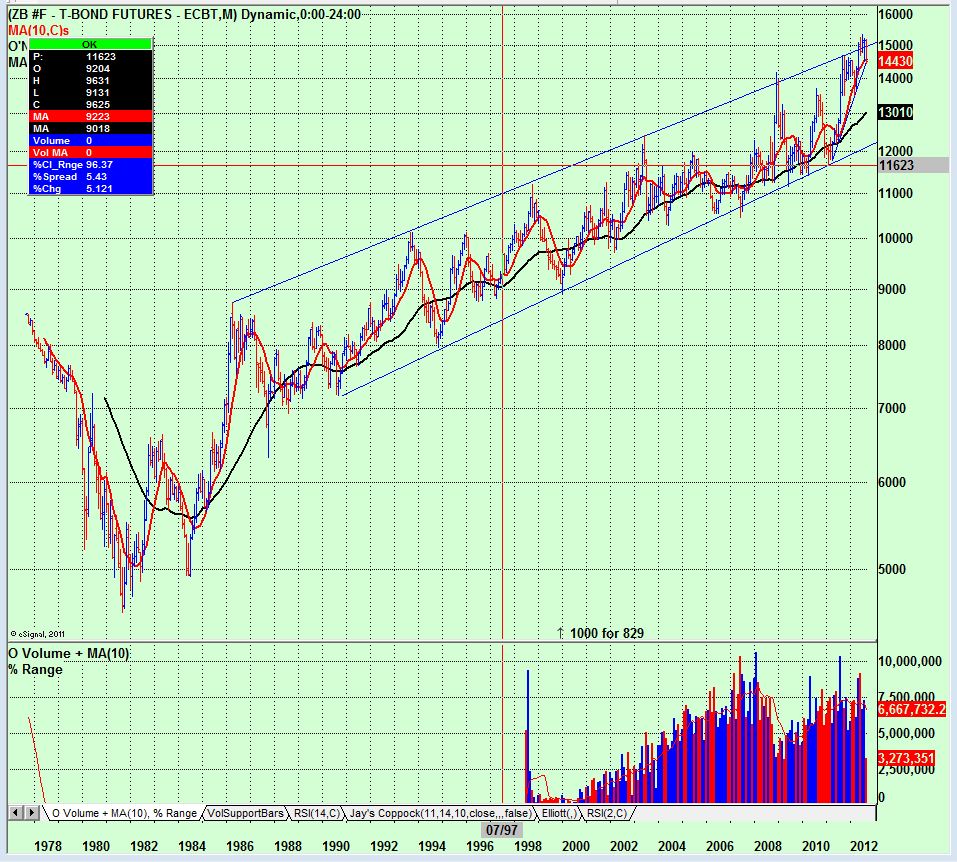
    When I look at a long-term chart of the 30-year bond I can draw a reasonably well formed channel going back to 1986. In each prior case when the bond market hit the upper trend line it responded by moving to the lower trend line. I guess that is what I expect again. The chart below is a monthly interval chart. On a weekly or shorter interval chart a possible head and shoulders pattern exists and we have undercut the lows of the right shoulder but not the downward sloping neckline yet. I have a minus 10% from the peak downside target if this pattern goes to completion based on the pattern. If we are forming a major bond top then possibly a bounce at this target forming a right shoulder of an even larger multiple year head and shoulders pattern could develop. Bonds have been in a bull market since 1981 so a major top call could be premature. I don't think a minor top call is premature however. All bull markets have a beginning and an end, the bond bull will end someday.

    I guess if I have a concern about the current equities market it is that we have moved back up to long-term resistance highs again. In the 100+-year history of the market when we have been in a secular bear market (consolidation) this usually means we are close to the upper bound of the market until the secular bear conditions have abated. The currentl secular bear started in 2000 and on average they last 18 years. It may look like a sideways market since then but if you look at inflation effects the trend is most definitely downward. Using the Tuttle Asset Management theory which uses the Shiller cyclically adjusted S&P500 PE ratio (Price divided by average 10-tear earnings) we are a very long way from meeting the conditions to establish a new secular bull market. So anybody want to bet that this time is different? The Fed is taking some unprecedented action so it beats me... I will follow the price and volume of the major indices and see what unfolds.

    Name:  ZB.JPG
Views: 199
Size:  240.4 KB
    Mike Scott
    Cloverdale, CA

  2. #2
    Join Date
    Dec 1969
    Location
    Tarzana, CA
    Posts
    962
    I had a request for explanation of the Shiller stuff and 100-year dow theory. I have gone through this before but here is an update.

    There are two attachments:

    100YearMarketTheory-2011.pdf

    and this 111-year chart which starts in 1900 and stops in 2011.
    Name:  100 Year Dow Chart.GIF
Views: 141
Size:  389.2 KB

    I have used a predecessor of the chart before. The quick summary of the pdf file which discusses the chart and uses finer grained charts also is:
    (1) markets become overly expensive (Bubble) from time to time (e.g., 1929, 1966, 2000) as measured by the Cyclically Adjusted S&P500 P/E (CAPE > 22, lower plot). That data was prepared by Professor Shiller (Yale Economics). He shares updated CAP/E data in a spreadsheet at this URL:
    [URL="http://www.econ.yale.edu/~shiller/data.htm[/URL]. The the data in this source goes back to 1871...

    (2) When the bubble market occurs the market eventually goes into a long-term (secular) sideways or down period for one to two decades. That period will include multiple cyclical bull and bear markets but make no overall progress. It essentially stays between upper and lower secular price boundaries (porosity allowed). We are near an upper boundary now.

    (3) When the market becomes very cheap again (CAPE <10) by a combination of earnings growth and price erosion the market can eventually mount a new secular bull market that can last for a decade or more. Current CAPE is still hovering near bubble territory (21). I have a suspicion that the reason it takes so long to correct an expensive market is that the government won't let the markets correct but try to reflate what ever bubble is popping at the time.

    (4) Current period from 2000 seems to be tracking history and the question on the table this morning because of the unprecedented QE enviornment is "Will this time be different". This chart illustrates the S&P500 during the current secular period as it approache the upper bound: Name:  S&P500 Secular Period.GIF
Views: 168
Size:  167.3 KB


    Mike Scott
    Cloverdale, CA

  3. #3
    Thank you Mike. Very interesting!

  4. #4
    Join Date
    Dec 1969
    Location
    New Jersey
    Posts
    189
    Yes, thank you Mike and all the other contributors on this site!
    Harry

+ Reply to Thread

Posting Permissions

  • You may not post new threads
  • You may not post replies
  • You may not post attachments
  • You may not edit your posts