9-17-2012 Comments
I don't know if it means anything that few canslimers can find anything to put on a watch list right now, but that is the situation. Everything that has been buyable is extended now. This may mean the market needs some breathing room on the short term. The market exposure model has been fully invested since August 6 and has just stayed there. We did see a stall day on the S&P500 on Friday raising the distribution count to 2 on that index. The last distribution day (stall day) on the NASDAQ was three weeks ago.
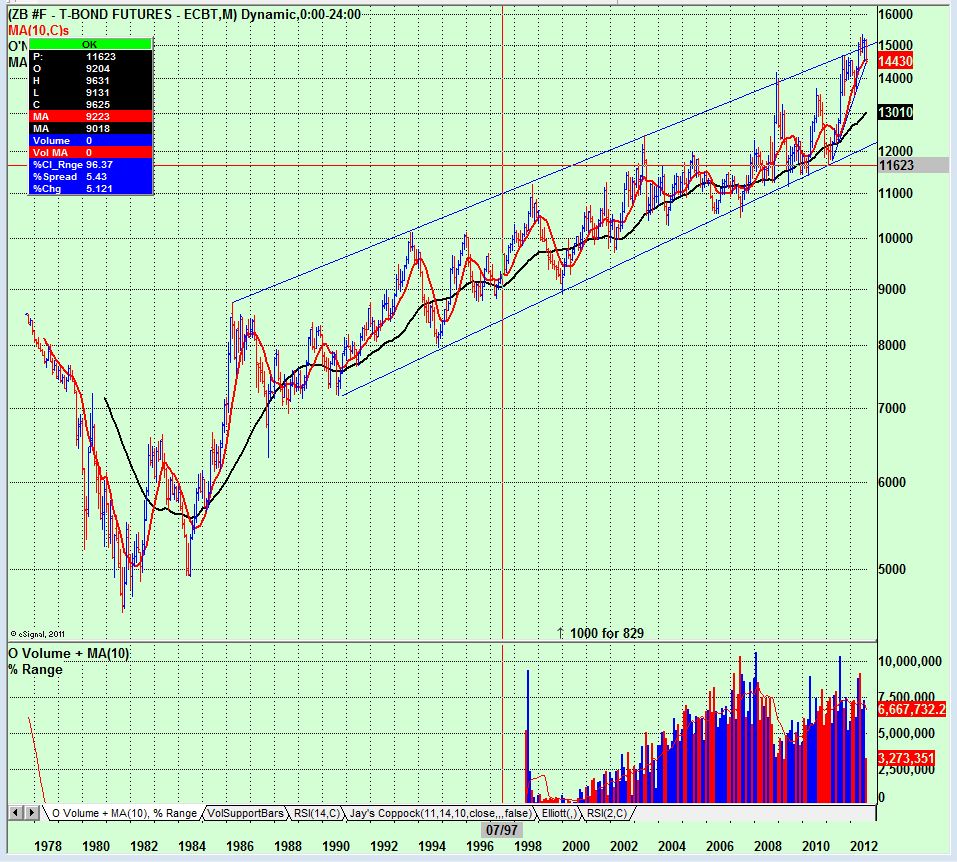
When I look at a long-term chart of the 30-year bond I can draw a reasonably well formed channel going back to 1986. In each prior case when the bond market hit the upper trend line it responded by moving to the lower trend line. I guess that is what I expect again. The chart below is a monthly interval chart. On a weekly or shorter interval chart a possible head and shoulders pattern exists and we have undercut the lows of the right shoulder but not the downward sloping neckline yet. I have a minus 10% from the peak downside target if this pattern goes to completion based on the pattern. If we are forming a major bond top then possibly a bounce at this target forming a right shoulder of an even larger multiple year head and shoulders pattern could develop. Bonds have been in a bull market since 1981 so a major top call could be premature. I don't think a minor top call is premature however. All bull markets have a beginning and an end, the bond bull will end someday.
I guess if I have a concern about the current equities market it is that we have moved back up to long-term resistance highs again. In the 100+-year history of the market when we have been in a secular bear market (consolidation) this usually means we are close to the upper bound of the market until the secular bear conditions have abated. The currentl secular bear started in 2000 and on average they last 18 years. It may look like a sideways market since then but if you look at inflation effects the trend is most definitely downward. Using the Tuttle Asset Management theory which uses the Shiller cyclically adjusted S&P500 PE ratio (Price divided by average 10-tear earnings) we are a very long way from meeting the conditions to establish a new secular bull market. So anybody want to bet that this time is different? The Fed is taking some unprecedented action so it beats me... I will follow the price and volume of the major indices and see what unfolds.

Mike Scott
Cloverdale, CA


 Reply With Quote