7-19-12 Comment
IBD has the market "Under Pressure" the Market School Model has the market in correction waiting for a follow-through day. We have seen two days of accumulation (up on higher volume) in the NASDAQ and a small gap up this morning. So far NASDAQ volume is running at a slower rate than yesterday but the NYSE volume is running higher. If we positive today without a sell off below the 21-day ema we will see a B3 buy signal on the NASDAQ. With the buy switch off this means we put the buy signal in our back pocket to be acted on later in the case of a FTD. Large Caps are doing better than small right now evidenced by the S&P500 out performing the NASDAQ or the S&P600. Pascal has been watching the potential double top in the S&P500 which I am watching also. I consider the S&P500 to be the leading index right now and what it does the rest will likely follow.
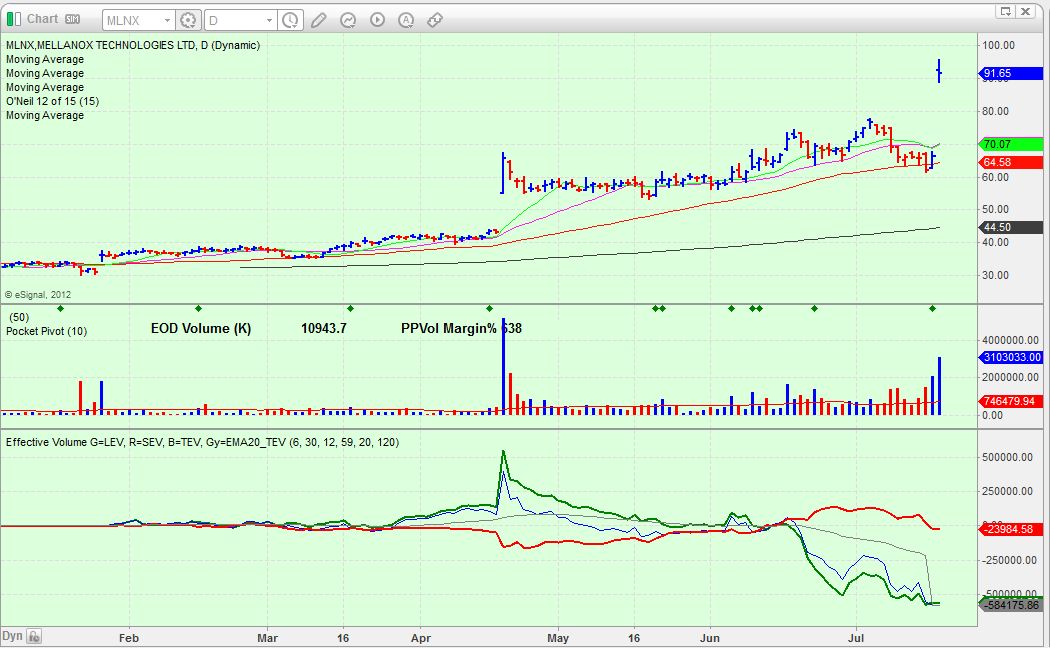
Some stocks are confounding investors such as MLNX. MLNX breaks out on 6/11 and then proceeds to drop more than 8% of the buy price forcing disciplined investors to sell. It did this just before an earnings report. Then it gaps up on a good earnings report last night after hours. Some stocks just get away from you like this. If one got shaken out on 7/17, yesterday's move back up above the 50-day on higher volume than the shakeout should have gotten your attention. When Bill O'Neil gets shaken out of a position that he has conviction in and the stock recovers on substantial volume his principle is to buy it back plus a little bit more (like 10%). MLNX also showed a pocket pivot buy point yesterday.
I was not faced with that decision as I did not enter MLNX. Had I owned it I would have sold it in advance of the earnings report at a loss and because of the EV pattern I probably would not have followed the O'Neil procedure. Below is the EV chart and it just did not look inviting.
I love this quote from an O'Neil seminar in response to a vexing situation like MLNX:
"If this were easy, everybody would be doing it!"
Mike Scott
Cloverdale, CA


 Reply With Quote
