+ Reply to Thread
Results 1 to 10 of 10

Thread: 6-22-12 Comments

  1. #1
    Join Date
    Dec 1969
    Location
    Tarzana, CA
    Posts
    962

    6-22-12 Comments

    Yesterday the NASDAQ closed more than 0.2% below the 21-day ema and signaled an S5 sell signal bringing the exposure count down to +1 (30% invested). We barely missed an S10 bad break sell signal which happens on a 2.5% down day. IBD placed the market condition to: Market Under Pressure.

    I liquidated ALGN and FIRE but remain in KORS, TDG, AAPL and N. All of these are half-sized (10%) positions. This means I am slightly overexposed at 40% invested. I had taken a position with a pocket pivot on June 6 in MLNX but on 6-20 I sold and took profits because the LEV situtation was showing substantial negative divergence. I find that Effective Volume is useful to help choose what to do with the portfolio when it comes time to choose which stocks to jetison and which stocks to buy given a multiple choice situation. The eSignal EV script works well for those stocks that are not in the EV database. It takes approximately 15-20 seconds to run largely I believe because the minute data for 120 days (46,800 price and volume data points) takes that much time to download from the eSignal server. I believe this script is server data restricted because eSignal only takes 15% of CPU resources when running EV.

    As far as to where the market goes from here, I have no opinion. I have done some recent research into methods proposed in 1971 by Richard Arms in his book Profits in Volume. He wrote the following two statements:

    1. The volume that is generated in the building of a base is almost exactly the volume disapated in the ensuing advance.

    2. The volume occuring in a top formation is very close to the same as the volume in the subsequent decline.

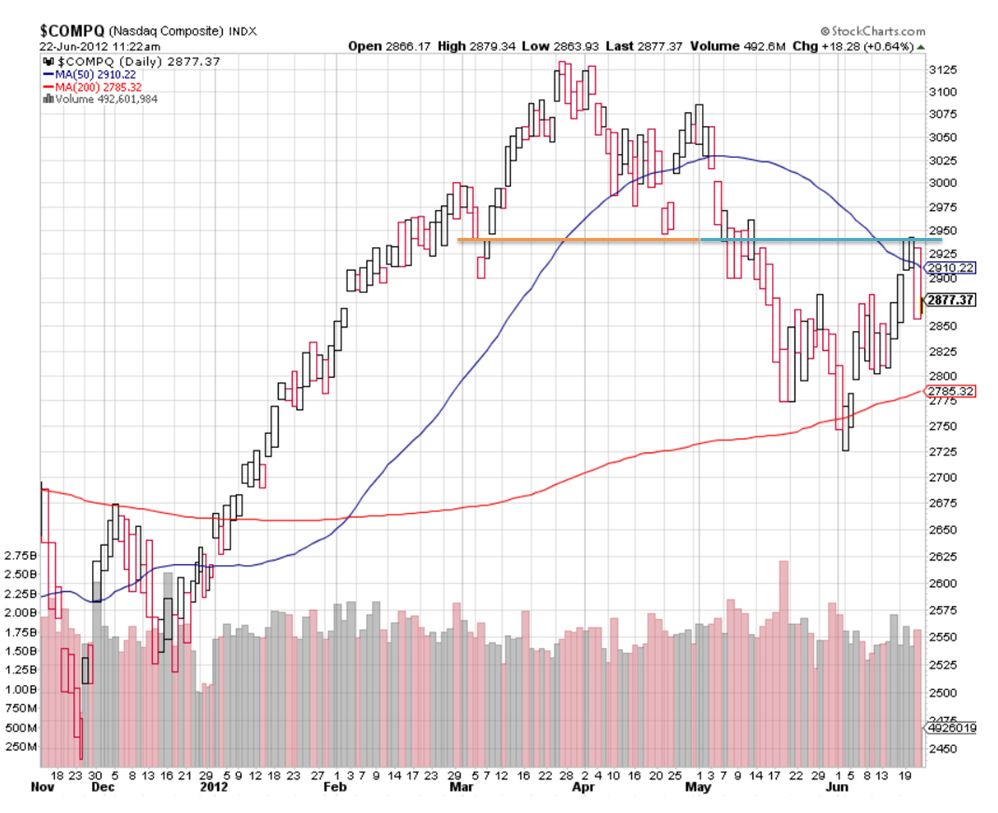
    I offer this view of the NASDAQ on an equivolume chart. An equivolume chart is linear in volume on the X axis and not linear in time. The orange line is my estimate of the total volume contained in the topping structure. The blue line is exactly equal in length of the orange line and thus equal to the same volume as the orange line. You can see that we are within one or two days of completing the volume condition in statement #2 above. From here we don't know the direction the market may take but if Arms is correct, expect a change from sideways to a leg down or up beginning soon.

    Name:  NASDAQ Equivolume.JPG
Views: 305
Size:  127.3 KB
    Mike Scott
    Cloverdale, CA

  2. #2

    The importance of the low of the FTD day

    Hi Mike,

    I don't remember if it was you, Billy or someone else. But a few years ago, I remember that someone made a mention about the importance that the low of the FTD should not be broken, otherwise, the rally could be declared over. If it is the case, what are the conditions to confirm a rally again? Is it a new FTD?

    Thanks in advance,

    Martin

  3. #3
    Join Date
    Dec 1969
    Location
    Tarzana, CA
    Posts
    962
    Quote Originally Posted by mnoel View Post
    Hi Mike,

    I don't remember if it was you, Billy or someone else. But a few years ago, I remember that someone made a mention about the importance that the low of the FTD should not be broken, otherwise, the rally could be declared over. If it is the case, what are the conditions to confirm a rally again? Is it a new FTD?

    Thanks in advance,

    Martin
    Martin,
    A close below the lows of a FTD usually leads to a failed rally but not always. How the Market School Exposure Model handles this is this is an S1 sell signal (Follow-Through Day undercut). Usually when this happens the exposure is very low to start as the rally has to be weak to be undercutting the FTD lows. This often takes you down to zero exposure. It does not turn the buy switch off however (same as saying market in correction). To turn the buy switch off requires either zero exposure with a full distribution count or undercutting the entire rally attempt (undercut the prior low where the rally count started prior to the FTD). When the buy swtich goes off we wait for a new FTD. There is a rare instance when the buy switch can be turned on by rallying up above a prior marked high on the chart (9-day high looking both ways). This is quite rare to occur without seeing a FTD.
    Mike Scott
    Cloverdale, CA

  4. #4
    Thank you very much Mike!

    Martin

  5. #5
    Join Date
    Dec 1969
    Location
    Virginia, USA
    Posts
    16

    6/21 distribution signals

    Hi Mike,

    Doesn't the break on 6/21 also triggered S9 signal with the break below 50D ? Also, is there any statistics that speak to distribution days within a certain days of an FTD and its implication to rally success ? The current action is somewhat similar to 12/20/11 FTD where we had S1 distribution signal the next day 12/21 but it turned out to be a good bull run so my guess is as long as the DD are not back to back, the rally case is still on.

    Also, does the behavior of leading stocks override some of the exposure decisions in this model ? We seem to have good money rotation into fresh leading issues such as ALXN, PCYC, TRIP, FB. A lot of the old leaders seem almost ready to move again now with decent base in place AAPL, AMZN, LNKD, KORS, MA, PCLN, CMG, ULTA. Overall a mix bag but the breakdown on the early leaders from 6/5 bottom are showing concerning signs: LQDT, BBBY, UA, MNST, REGN, SXCI, CERN, MLNX, EQIX.

    Thanks-
    Ken

  6. #6
    Join Date
    Dec 1969
    Location
    Tarzana, CA
    Posts
    962
    Quote Originally Posted by Ken View Post
    Hi Mike,

    Doesn't the break on 6/21 also triggered S9 signal with the break below 50D ? Also, is there any statistics that speak to distribution days within a certain days of an FTD and its implication to rally success ? The current action is somewhat similar to 12/20/11 FTD where we had S1 distribution signal the next day 12/21 but it turned out to be a good bull run so my guess is as long as the DD are not back to back, the rally case is still on.

    Also, does the behavior of leading stocks override some of the exposure decisions in this model ? We seem to have good money rotation into fresh leading issues such as ALXN, PCYC, TRIP, FB. A lot of the old leaders seem almost ready to move again now with decent base in place AAPL, AMZN, LNKD, KORS, MA, PCLN, CMG, ULTA. Overall a mix bag but the breakdown on the early leaders from 6/5 bottom are showing concerning signs: LQDT, BBBY, UA, MNST, REGN, SXCI, CERN, MLNX, EQIX.

    Thanks-
    Ken
    Ken, the break below the 50-day was not an S9 sell signal. Before we can have an S9 there has to be a prior B6 (lows above the 50-day). This relationship is to prevent signal churning around the 50-day.

    Here are the distribution statistics presented recently at an IBD seminar I have done similar research with nearly the same results:
    Distribution day 1 or day 2 after a FTD: 95% rally failure rate
    Distribution day 3 after a FTD: 80% rally failure rate
    Distribution day 4 or 5 after a FTD: 30% rally failure rate

    As you noted distribution right after a FTD doesn't mean 100% failure...

    Action of leading stocks is very important and is the final arbiter of whether we are in a confirmed uptrend. This is somewhat subjective and takes experience to know when enough leadership is there and whether they are coming under pressure. I track breakouts which has been looking okay except for the fact that the breakouts that occured on or after the FTD are on average below their buy points. Stocks that broke out in advance of the FTD are up okay. So from a leading stock situation I would say they are under pressure.
    Mike Scott
    Cloverdale, CA

  7. #7

    DD on d4 or d5 after FTD? Only 30%

    Hi Mike,

    I thought the overall failure rate of all FTD's (regardless of DD's) was around 60-65%.

    Last Th, Jun 21's DD would have been a d4 DD.

    The high failure rate stats you cite for DD's on d1, d2, and d3 are certainly consistent with everything I heave read or heard on the subject from you and others (e.g. Minervini, Zanger, etc)...

    But, mathematically, a 30% failure rate relating to a d4 or d5 DD would actually be much better than the *average* FTD.

    30% seems too high to me, I would have guessed d4 or d5 DD would lead to something like a 70-75% failure rate?

    Assuming 30% is the correct number, what am I missing?

    Thanks,

    Shawn

  8. #8
    Join Date
    Dec 1969
    Location
    Tarzana, CA
    Posts
    962
    Quote Originally Posted by shawn_molodow View Post
    Hi Mike,

    I thought the overall failure rate of all FTD's (regardless of DD's) was around 60-65%.

    Last Th, Jun 21's DD would have been a d4 DD.

    The high failure rate stats you cite for DD's on d1, d2, and d3 are certainly consistent with everything I heave read or heard on the subject from you and others (e.g. Minervini, Zanger, etc)...

    But, mathematically, a 30% failure rate relating to a d4 or d5 DD would actually be much better than the *average* FTD.

    30% seems too high to me, I would have guessed d4 or d5 DD would lead to something like a 70-75% failure rate?

    Assuming 30% is the correct number, what am I missing?

    Thanks,

    Shawn
    Shawn,

    You are right that the overall failure rate is high for any FTD when the criterial for failure is a rally where the market does not go up 10% or more from the FTD and the rally last at least 5 weeks which is the criterial I usually use. IBD didn't disclose their criterial which is obviously looser. But both sets of data show extremely high failure rates for distribution very close to the FTD.
    Mike Scott
    Cloverdale, CA

  9. #9
    Join Date
    Dec 1969
    Location
    Virginia, USA
    Posts
    16
    Quote Originally Posted by mscott View Post
    Ken, the break below the 50-day was not an S9 sell signal. Before we can have an S9 there has to be a prior B6 (lows above the 50-day). This relationship is to prevent signal churning around the 50-day.
    Hi Mike, does this relationship also apply to B3 and S5 signals ? For instance, would actions of today 6/25 be considered an S5 signal or do we need a B3 signal first ?

    Best-
    Ken

  10. #10
    Join Date
    Dec 1969
    Location
    Tarzana, CA
    Posts
    962
    Quote Originally Posted by Ken View Post
    Hi Mike, does this relationship also apply to B3 and S5 signals ? For instance, would actions of today 6/25 be considered an S5 signal or do we need a B3 signal first ?

    Best-
    Ken
    Ken, there are several relationships between buy and sell signals that reset each other. Here they are:

    You can't have a B3 (Lows above 21 ema), B4 (5 days of lows above the 21-day ema) or B5 (10 days of lows above the 21 day ema) signal without a prior S5 signal (Break below the 21-day, closing down at least 0.2% below).

    You can't have an S5, S6 (Overdue break below the 21-day--no S5 for the last 25 days), S7 (5 days of highs below the 21-day), S8 (10-days of highs below the 21-day) without a prior B3

    You can't have an S9 (Close below the 50-day) without a prior B6 (lows above an uptrending 50-day)

    You can't have a B6 without a prior S9
    Mike Scott
    Cloverdale, CA

+ Reply to Thread

Posting Permissions

  • You may not post new threads
  • You may not post replies
  • You may not post attachments
  • You may not edit your posts