


Thanks Billy. It's unfortunate that historical data are not accessible.
Regards,
Martin

Thanks Billy. It's unfortunate that historical data are not accessible.
Regards,
Martin
Mike,
Have you parsed out historical returns for June in election years only? See link below:
http://www.ritholtz.com/blog/2012/05...lection-years/

Originally Posted by adam ali

Adam, I have parsed the election years. Pardon the unformated list below which is every rally that began in an election year in my database. Missing here will be any rally that began the year before and carried into an election year. There are plenty of rallies that started earlier in the year and carried into June for good gains. There just aren't any that entered June in a correction and began a healthy ascent.
Date (length of raly days) Percent Gain
1/6/1976 ( 67) 10.70%
4/20/1976 ( 21) -1.50%
6/17/1976 ( 46) -0.10%
9/1/1976 ( 21) -0.20%
11/4/1976 ( 3) -2.20%
11/18/1976 ( 66) 6.60%
4/2/1980 (175) 39.00%
12/17/1980 ( 22) 2.40%
1/4/1984 ( 15) -1.30%
3/16/1984 ( 14) -3.00%
5/1/1984 ( 15) -3.80%
6/4/1984 ( 23) -0.90%
8/1/1984 ( 38) 7.10%
10/18/1984 ( 20) -1.50%
12/18/1984 ( 66) 13.50%
5/31/1988 ( 40) 3.50%
11/30/1988 ( 77) 7.80%
4/14/1992 ( 8) -4.70%
7/9/1992 ( 32) -1.70%
9/10/1992 (109) 14.50%
1/19/1996 ( 29) 6.60%
4/16/1996 ( 44) 5.20%
8/1/1996 (145) 19.50%
2/3/2000 ( 39) 5.90%
4/25/2000 ( 10) -3.40%
5/16/2000 ( 4) -9.50%
5/30/2000 ( 42) 5.90%
8/17/2000 ( 18) -1.20%
9/28/2000 ( 2) -5.50%
10/26/2000 ( 10) -2.20%
12/5/2000 ( 8) -8.20%
12/27/2000 ( 3) -9.70%
3/29/2004 ( 22) -1.70%
5/25/2004 ( 31) -1.40%
8/18/2004 ( 97) 14.20%
1/31/2008 ( 25) -7.40%
4/1/2008 ( 59) 0.20%
7/29/2008 ( 27) -2.70%
9/25/2008 ( 2) -9.30%
10/16/2008 ( 4) -5.90%
11/4/2008 ( 2) -9.60%
12/2/2008 ( 29) 2.70%
Mike Scott
Cloverdale, CA
Ok - I note if one went back one week in time, you'd find an additional three instances of market rally signals being generated:
5/25/04 - (1.40%)
5/30/00 - 5.90%
5/31/88 - 3.10%
6/17/76 - (0.10%)
6/4/84 - (0.90%)
To me, a bit inconclusive.
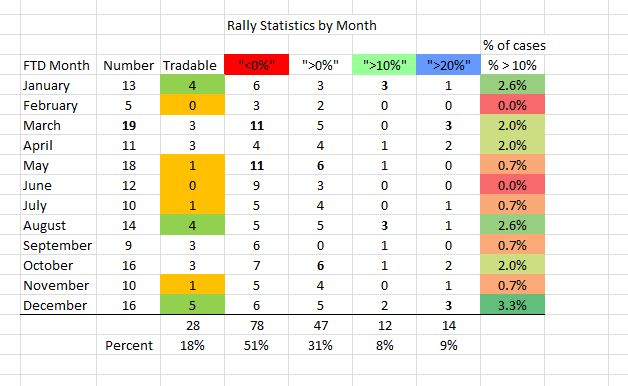
Here are all rallies including election years. The only May or June rally that added up to anything was May 4 1993 that went up 11.7%. I am sure if I could go back more than 40 years I could find some other examples. One day I will be in position go go back 100 years on the Dow.
Mike Scott
Cloverdale, CA
Thanks, Mike.
This is quite interesting and useful. I see your point about the size of rallies beginning at or around June.
 Posting Permissions
 Reply With Quote