+ Reply to Thread
Results 1 to 7 of 7

Thread: IWM Correlation Scoring - June 15, 2012

  1. #1
    Join Date
    Dec 1969
    Location
    Brussels, Belgium
    Posts
    1,999

    IWM Correlation Scoring - June 15, 2012

    The first chart below is excerpted from my work in progress researching a predictive correlation score indicator for IWM setups. It is predictive in the sense that all of its bricks are taken from multi-timeframes internal market structures like stages, IBD ratings, sectors relative strengths or CBOE future implied correlation indexes. These correlation bricks have no direct link whatsoever with macroeconomics and news. In other words, it predicts the highest probability edges for IWM in the near future independently of and barring all forthcoming exogenous news like the Greek elections or FOMC policy statements. At this stage of my findings, edges are favoring short trade setups when the score is below the 20-day moving average and favoring long setups when above the 20-day moving average. By trade setups, I mean opportunities to buy the dips or sell the blips.

    Name:  corsc.gif
Views: 294
Size:  46.3 KB

    So, where are we now? The edges have been in favor of short setups (selling the blips) since 2/29/2012. But for the first time since then, a market closing flat today would be enough to turn the score above the 20 dma in favor of long setups (buying the dips). I will keep you updated this weekend to let you know if the indicator change is confirmed. This would then suggest that any weakness in IWM could be bought early next week.

    The IWM robot has turned neutral for new positions. A flat or higher close today would confirm the very strong support cluster offered by Quarterly S1 (75.90) and the 200 dma (75.89). Daily S2 (74.63) seems to be an appropriate stop threshold for aggressive early long traders.

    Name:  iwm120+15.gif
Views: 301
Size:  45.5 KB

    The GDX robot is looking for a secondary short entry at a limit of 47.01. I’ll keep repeating that it is risky to be too aggressive on the short side while GDX trades above its Yearly pivot (44.77).
    Billy
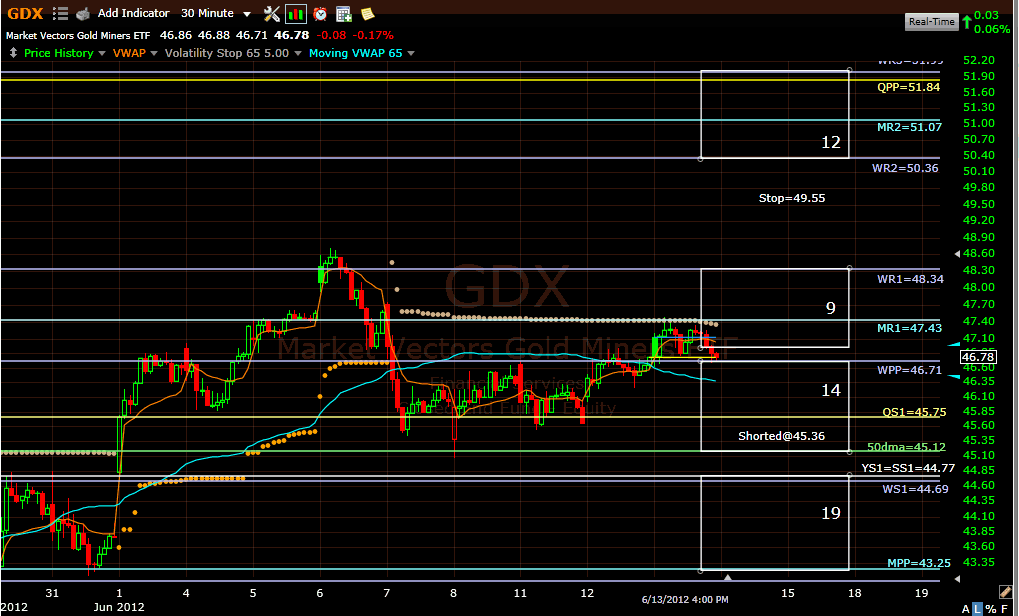
    Name:  gdx120614.gif
Views: 243
Size:  44.8 KB

  2. #2
    Join Date
    Dec 1969
    Posts
    1,585
    This looks like very promising work, Billy.

  3. #3
    Join Date
    Dec 1969
    Location
    Brussels, Belgium
    Posts
    1,999
    Quote Originally Posted by EB View Post
    This looks like very promising work, Billy.
    I am trying to objectively quantify the input from various tools external to EV that I found helpful in discretionarily guiding my aggressiveness/position-sizing in the IWM robot setups and the 20 DMF model. All correlations are made with IWM only, therefore they are not optimized for other indices like SPY or QQQ.

    It is not supposed to become another market timing model ( rushing to chase the market after a signal change), but instead it is trying to track when market structure by itself is in favor of long or short setups with entries on pullbacks. For example in a weakly correlated market structure score like now, it is dangerous to buy pullbacks as long as you don’t have the 20 dma cushion supporting the score.

    It is also a dynamic scoring system because you can improve daily the fine-tuning of the correlations as more data gets collected over time. I am far from being ready to present it in detail because I am still only in the creative process and I’d like to let expert statisticians check and refine my findings before defending them publicly.

    Billy

  4. #4
    Join Date
    Dec 1969
    Location
    Long Island, New York
    Posts
    515

    Bullish and Bearish Sectors

    Billy,

    I'm having some progress with my own examination of the ratio of money-flow between bullish and bearish sectors. My own model is a lot slower than the work you and Pascal are doing, so I don't know how well it would translate.

    But if you were to take a measure of the effective volume in bullish sectors (XLY,XLK,XLI,XLB) versus bearish sectors (XLP,XLV,XLU,XLF) it MIGHT be useful as a confirmation tool.

    Seems to work in the time frames I measure, but might not work at all in yours.

    (You'll note I left out XLE -- energy doesn't seem to be useful either way in my time frames).


    Tim

  5. #5
    Join Date
    Dec 1969
    Location
    Brussels, Belgium
    Posts
    1,999
    Quote Originally Posted by Timothy Clontz View Post
    Billy,

    I'm having some progress with my own examination of the ratio of money-flow between bullish and bearish sectors. My own model is a lot slower than the work you and Pascal are doing, so I don't know how well it would translate.

    But if you were to take a measure of the effective volume in bullish sectors (XLY,XLK,XLI,XLB) versus bearish sectors (XLP,XLV,XLU,XLF) it MIGHT be useful as a confirmation tool.

    Seems to work in the time frames I measure, but might not work at all in yours.

    (You'll note I left out XLE -- energy doesn't seem to be useful either way in my time frames).


    Tim
    Tim,
    Thank you for sharing your ideas and your own work which I follow with much interest.
    I am a strong proponent of relative strength and need to discuss with Pascal the idea of a XLX ranking of money flow relative strengths.

    As for my own scoring work, I am avoiding to mix EV data because I want to know how much “cooperative” market structure will be (independently of EV) for the success of IWM robot setups and other EV based signals. The disparate weights of the various sectors in the IWM and their frequent rebalancing make your approach delicate. The fact that the XLX ETF’s are mostly including large cap stocks could also lead to errors for a small cap index.
    Billy

  6. #6
    Billy; Why wasn't a "cover your short' signal issued after the close on Thursday 5/14 when the 20 DMF closed at 0.239% and the Avg TEV Inv was at 2.03%.
    Thank you in advance.
    Robert

  7. #7
    Quote Originally Posted by brrim View Post
    Billy; Why wasn't a "cover your short' signal issued after the close on Thursday 5/14 when the 20 DMF closed at 0.239% and the Avg TEV Inv was at 2.03%.
    Thank you in advance.
    Robert
    Robert,

    The 20DMF was indeed showing a neutral position by the close of last Thursday, and the RT 20DMF turned neutral early during that day. I posted the RT 20DMF figure also on my comment of Friday morning. But, you are right: I only said since a few days that it was safer to stay in cash, but I did not explicitly write that the 20DMF moved to cash.


    Pascal

    Name:  20DMF_Top.gif
Views: 196
Size:  10.7 KB

+ Reply to Thread

Posting Permissions

  • You may not post new threads
  • You may not post replies
  • You may not post attachments
  • You may not edit your posts