The first chart below is excerpted from my work in progress researching a predictive correlation score indicator for IWM setups. It is predictive in the sense that all of its bricks are taken from multi-timeframes internal market structures like stages, IBD ratings, sectors relative strengths or CBOE future implied correlation indexes. These correlation bricks have no direct link whatsoever with macroeconomics and news. In other words, it predicts the highest probability edges for IWM in the near future independently of and barring all forthcoming exogenous news like the Greek elections or FOMC policy statements. At this stage of my findings, edges are favoring short trade setups when the score is below the 20-day moving average and favoring long setups when above the 20-day moving average. By trade setups, I mean opportunities to buy the dips or sell the blips.
So, where are we now? The edges have been in favor of short setups (selling the blips) since 2/29/2012. But for the first time since then, a market closing flat today would be enough to turn the score above the 20 dma in favor of long setups (buying the dips). I will keep you updated this weekend to let you know if the indicator change is confirmed. This would then suggest that any weakness in IWM could be bought early next week.
The IWM robot has turned neutral for new positions. A flat or higher close today would confirm the very strong support cluster offered by Quarterly S1 (75.90) and the 200 dma (75.89). Daily S2 (74.63) seems to be an appropriate stop threshold for aggressive early long traders.
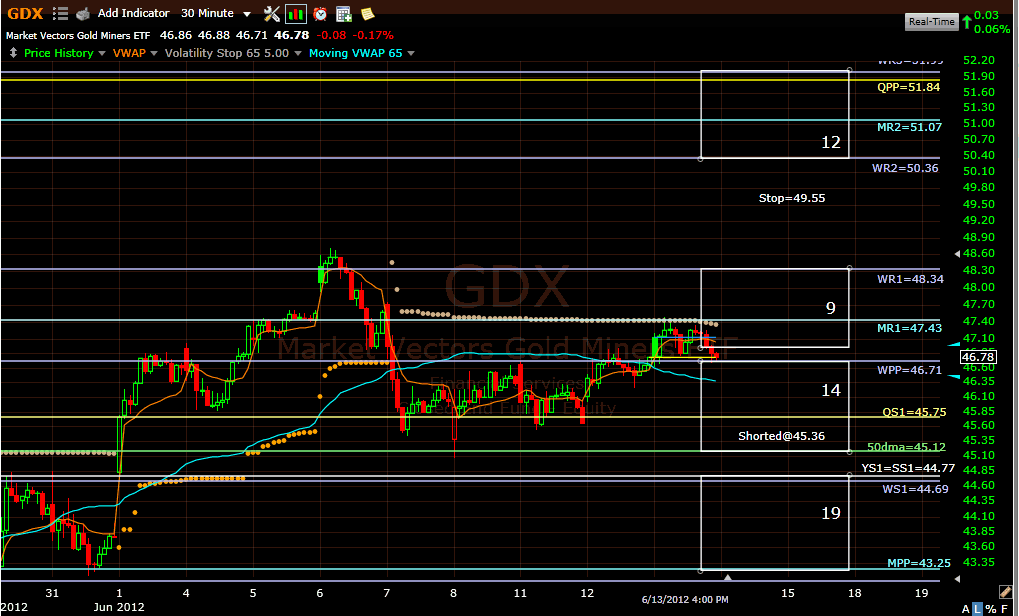
The GDX robot is looking for a secondary short entry at a limit of 47.01. I’ll keep repeating that it is risky to be too aggressive on the short side while GDX trades above its Yearly pivot (44.77).
Billy


 Reply With Quote