Using Average True Range at Major Market Tops and Bottoms
I am still waiting for a FTD so had time to put some thoughts together...
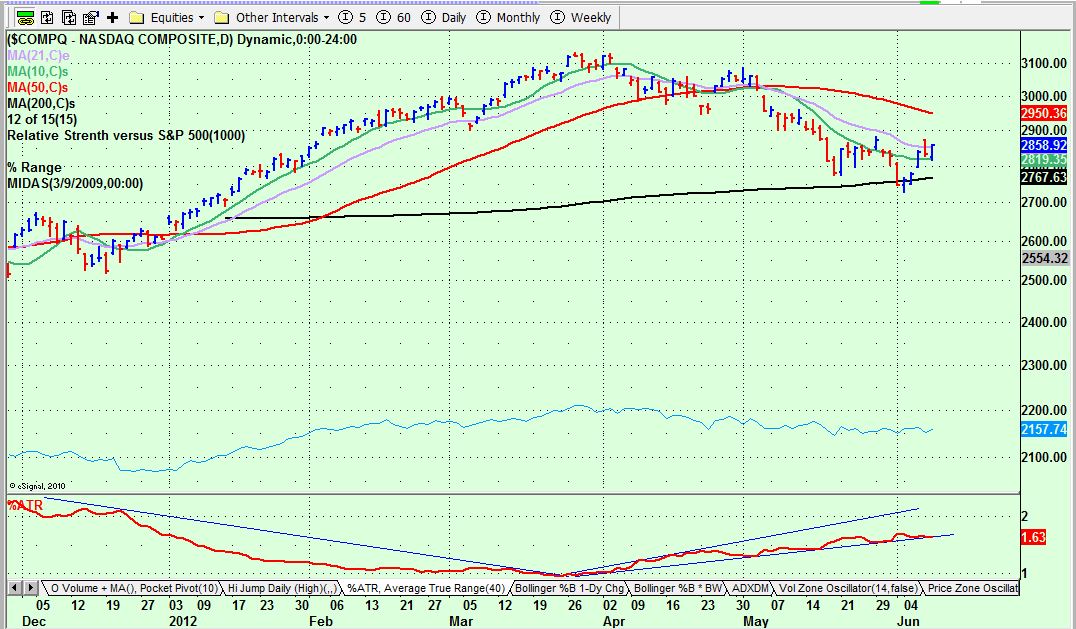
I track 14-day average true range on the NASDAQ. I modify ATR(14) to plot in percent of the underlying index. This is a measure of true volatility as opposed to $VIX which has an emotional component. Using percent in the calculation is only important for studies comparing different price regimes. Using a vanilla ATR(14) indicator would work with my findings I show below also:
1. When a new bull market begins ATR% will be high maybe as high as 6-7 percent but it will be on a definite and obvious downtrend when the real FTD occurs ushering in a new bull market.
2. ATR% will normally continue a downward or flat trajectory for the length of the bull market, this will hold true through average pull backs.
3. If we face a major correction (flash crash for example) ATR% will take a leg upward coincident with the drop and then continue the downward trajectory when the uptrend resumes.
4. When ATR% starts making higher highs and higher lows over a longer period in an advancing or stalling bull market a major top is in process. This happened around May 2007 for example and January/February 2011.
5. FTDs fail at a very high rate when ATR% is in an uptrend (making higher highs and higher lows)
ATR% is currently in an uptrend, see chart below. Normally I see more warning (months) of a market topping process using ATR% than I see on this chart. This could mean that we arent done with the bull market yet, this is more like what I have seen during a major correction. However until ATR% breaks downward I call any near term FTD risky.
Here is my guess as to why ATR% may be something important to pay attention to. During a bull market institutions are engaging on the long side. Institutional buying stabilizes the market as they buy the dips and they attempt to not push stocks up rapidly. ATR% then naturally falls to lower values as the stability increases. Eventually when enough institutions enter a phase that they think the bull market may be ending soon they begin a distribution phase and shares pass to hotter hands. Whether this happens on a market gestalt basis or this is happening stock by stock because their holdings have predominantly moved to late stage bases I dont know. They stop buying the dips. Volatility then naturally creeps up evidenced by higher daily price fluctuations. This process often begins many months before the market finally tops. An uptrend in ATR% that is coincident with a top seems to be more suggestive of major 15%-20% corrections and may not indicate a new bear market phase. It can also happen with the sharp short term bear markets, 1987.
Mike Scott
Cloverdale, CA


 Reply With Quote