+ Reply to Thread
Results 1 to 7 of 7

Thread: Bwld

  1. #1
    Join Date
    Dec 1969
    Location
    Tarzana, CA
    Posts
    962

    Bwld

    I bought BWLD and decided to hold through the earnings report. Partially because I liked the LEV setup. It appears that large players have consistently supported BWLD, it has been basing since last July which is plenty of time to put gas in the tank.

    BWLD is in an IBD industry group that is not particularly strong with a group rating of only 61. This means that 39% of the groups are performing better than the Retail-Restaurants group. When I see a low performing group I do a check of other stocks in the group. If I find at least two other stocks in the group that have both high EPS rating and high RS rating I call that group confirmation and conclude that the stock is not a lone wolf. BWLD is in the same group as PNRA which has an EPS rating of 96 and an RS rating of 96. PEET is the other member that has high RS and EPS ratings.

    If I had not built a cushion in my portfolio I would not have taken the risk of holding through the earnings report.
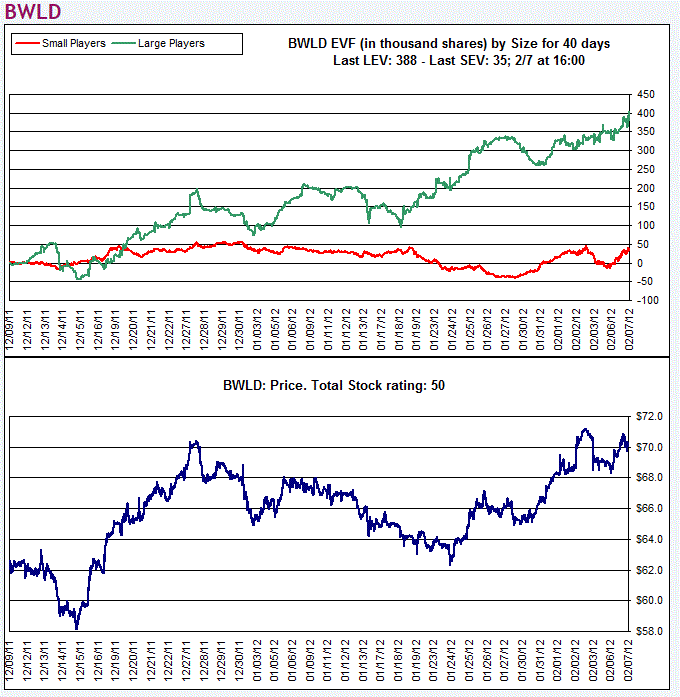
    Name:  BWLD EV Capture.GIF
Views: 341
Size:  32.4 KB
    Mike Scott
    Cloverdale, CA

  2. #2
    Join Date
    Dec 1969
    Location
    Louisiana
    Posts
    19
    Very nice call Mike,
    On the subject of group strength, I have an issue with MNST. Very poor group rank, looks like it is a lone wolf stock.
    However, I did start a small position on the "Livermore" breakout through $100. The chart looks very good still but the LEV has been deteriorating since. Earnings are a couple of weeks away, but I will be quick to sell on a breach of the 20 day sma. I guess my question is, Would you interpret the LEV as distribution here, or just a consolidation of the breakout? I seem to find myself with some of the right names, but I have become "gunshy" a bit and am quick to sell.
    Thanks
    Matt

  3. #3
    Quote Originally Posted by jmbarnette View Post
    Very nice call Mike,
    On the subject of group strength, I have an issue with MNST. Very poor group rank, looks like it is a lone wolf stock.
    However, I did start a small position on the "Livermore" breakout through $100. The chart looks very good still but the LEV has been deteriorating since. Earnings are a couple of weeks away, but I will be quick to sell on a breach of the 20 day sma. I guess my question is, Would you interpret the LEV as distribution here, or just a consolidation of the breakout? I seem to find myself with some of the right names, but I have become "gunshy" a bit and am quick to sell.
    Thanks
    Matt
    Matt,


    I'll respond to your questions.

    For stocks that break-out and tend to form a base, the LEV pattern must be used in combination with the AB.
    The Active Boundaries show you where the active traders stand in terms of profit/loss. When too many traders earn money, you will see a tendency for the LEV pattern to point down (profit taking) and the AB pattern to reverse back to its neutral zone (where the average profit is 0). At the neutral zone, there is no incentive to sell anymore. therefore, this is where you have to look at positive accumulation pattern for a "jump out of the base" sort of move.

    Here, LEV is down and furthermore, LER is -125, which means that compared to past selling tendencies, today's selling is rather strong.

    On the other hand, the UP target is still high and there is still room for the stock to go up, but you'd better wait for the selling to slow down first.


    Pascal

    Name:  MNST_AB.gif
Views: 287
Size:  23.1 KBName:  MNST.gif
Views: 247
Size:  22.4 KB

  4. #4
    Join Date
    Dec 1969
    Location
    Louisiana
    Posts
    19
    Thanks Pascal,
    This is where I typically find myself mismanaging positions, using "standard technical analysis" in buying such as this instance on a strong breakout, then studying LEV and AB to decide exits. In this case, I would be long gone in the name if we head toward the neutral zone. Trend would be damaged at that point, and MNST probably would not be on my watch because of the group rank. Trying to combine different strategies such as CANSLIM type investing with EV is probably not the prudent thing for me to be doing. I notice Mike's success with this combination and strive to learn it. I have noticed during this rally that most "early in the day breakouts" have been bait for novice CANSLIM investors (see MNST yesterday) with some exceptions. Anyway, thanks for helping to understand your system. Can hardly wait for the next robot signal!

  5. #5
    Hi Pascal,

    Do you have a document explaining the UB/LB/Neutral for the AB chart? I found a case where Neutral is outside of [LB, UB], and was very puzzled. (the symbol is TNE)

    Many thanks.

  6. #6
    Quote Originally Posted by Wei View Post
    Hi Pascal,

    Do you have a document explaining the UB/LB/Neutral for the AB chart? I found a case where Neutral is outside of [LB, UB], and was very puzzled. (the symbol is TNE)

    Many thanks.
    There is an explanation on the www.willain.com web site. Follow the arrow below. These are extracts from the VIT book.

    Name:  tmp.gif
Views: 239
Size:  39.1 KB

    In a strong uptrend, NB is sometimes below LB. This means that there are many traders who want to buy the stock. they do not wait for it to "come back to value".

    The same is true in a strong downtrend: everybody wants to sell and hence every little bounce is sold into. As a consequence, NB is above UB. This is the case for TNE. The AB have been fixed by the strong downtrend. The bounce is now pushing the price slightly above UB, but large players are selling this bounce, which means that there is a great probability that the stock will move back down again. If the bounce continues, that would mean that the character for the stock might be changing and that the stock would start a new uptrend. This would be the case if it is for example "pushed" up by the general market.

    Sorry for the brief reply.


    Pascal


    Name:  TNE_AB.gif
Views: 237
Size:  11.4 KB

    Name:  TNE.gif
Views: 232
Size:  31.2 KB

  7. #7
    Thank you so much for the reply. Really appreciate you taking the time to comment the chart and all.

    Thanks.

+ Reply to Thread

Posting Permissions

  • You may not post new threads
  • You may not post replies
  • You may not post attachments
  • You may not edit your posts