Thank you for this interesting discussion on the OB/OS and what other indicator might "fill the gap".
It is good to have experienced traders here and read these suggestions.
I understand that we are focusing on the OB/OS indicator because it missed to signal a bounce by a hair.
But, is it the culprit? When I started my trading education, I first read Alexander Elder's book (Come into my trading room,) where I found the best reference there, which has helped me a lot: the "hound of baskervilles." It is when the market moves in an unexpected way, contrary to your indicators. In such a situation you might conclude that there is something that should have been there but that was not measured.
Will a breath indicator solve the problem? In the first place, what IS the problem?
Is it the fact that we did not detect a new uptrend or is it the fact that we were in a short mode?
First, we need to remember that we are dealing with oscillators both for the upper and for the lower panel. This means that signals could be generated either due to a natural move of the oscillator below or above the 0 level (for the upper panel) or bounce above an oversold level - or due to real buying/selling moves.
The real issue with the 20DMF is that there are states from which the indicator is in a "non-recoverable" mode. The In such situations, 20DMF is waiting in cash until the next cycle starts. For example, today the 20DMF is in cash, waiting for a short signal.
What is really lacking on the 20DMF is the fear measure and its counterpart - the liquidity injection that compensates the fear. Cumulative ticks could be a good measure of liquidity injection, as liquidity would push all the stocks evenly.
Another measure that is available and not used on the 20DMF is the ATR. The ATR is the Average True Range. This is a good measure of market fear, as it catches the evolution of the max distance between High/Low/previous day close. When liquidity comes in, the ATR would be lowered, as any drop in price during the day would be compensated by HFTs pushing prices higher.
This reminds me that two other models use the ATR:
- The GDX OB/OS model always measures the ATR level and inhibits short signals when the ATR is too low.
- The IWM Robot measures the ATR "direction" when the 20DMF is in a "cover your shorts" mode and decides whether the previous trend should be continued or not depending on that specific measure.
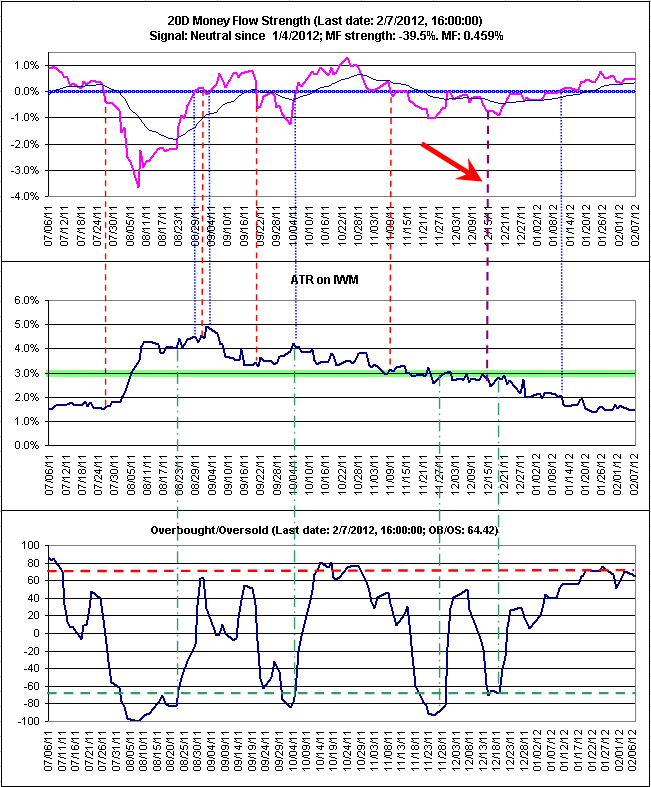
As we can see in the figure below, we had a short signal on December 15. This was due to the fact that we reverted to a cash situation on a fail safe mechanism, which was followed by a new short signal - on a MF negative state.
However, this short signal occurred in a context of decreased fear (ATR for IWM falling below 3%.)
This a path that I'd like to explore.
Pascal


 Reply With Quote