


IWM up over 2% with, if I read it correctly, neutral MF ?
Hard to understand ?
(From Tradestation 9.5 million shares traded close to the close) ?
Anybody an explanation for this ?
Trev

IWM up over 2% with, if I read it correctly, neutral MF ?
Hard to understand ?
(From Tradestation 9.5 million shares traded close to the close) ?
Anybody an explanation for this ?
Trev
This looks like an exhaustion spike where all the retail investors buy into the idea the trend will last.
In other words, "Bull Trap."
every time a short covers and the price goes pop, an angel gets his/her wings...
(cultural referent: Its a Wonderful Life)
Mr. Potter is always lurking...
pascal,
there seems to be a big divergence between MF and the price of IWM on the RT screen. also, there is a wedge setting up on the 5d MF. so i guess my questions are, doesn't it look like the market will be heading down? and do you pay any attention to or give any weight to patterns on the MF?
thanks,
lisa

You are right Lisa. The MF has been weak in the past days. This is why I am keeping (a discretionary and now underwater ) short position on the S&P500 (SDS bought at 17.40. SPY is weaker than IWM). However, the 20DMF needs to cross below "0" in order to provide a more reliable short signal than what a mere divergence can provide.Originally Posted by lisa

Type in "20" days in the RT figure and you will see the big picture of when the money stopped to move in.
Pascal
thanks, pascal. very enlightening though frustrating, right? at least your position in SCO, assuming you took one, should be doing well.
lisa

Wow, it really is a 20 day money flow:
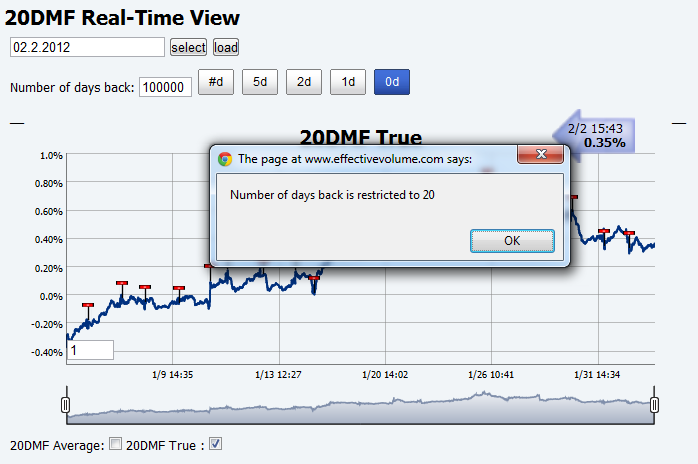

Bob,
You can actually change the selected date and see the 20 days graph for each date.
For example 20-day to 1/25/12
Billy
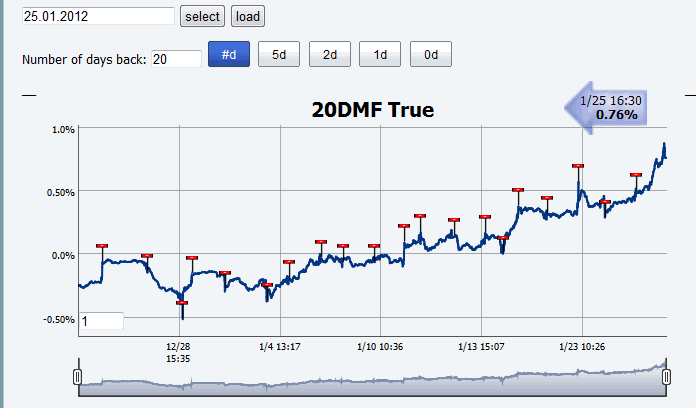
Great to know. It is a fantastic reference tool during the day.
 Posting Permissions
 Reply With Quote
