-
No Strategy Is Fast – January 30, 2012
« By thinking it’s all about strategy, a trader can get way too involved with each individual trades outcome, whereas in reality the success of the strategy relies on the edge provided over a large number of trades. This is the precise reason why no strategy is ‘fast’. The whole process takes time – time for trades to develop, time for accounts to grow, and time to allow the strategy’s edge to work. The whole process is long, and at times very slow.” Jessica Peletier – Roguetraderette.com
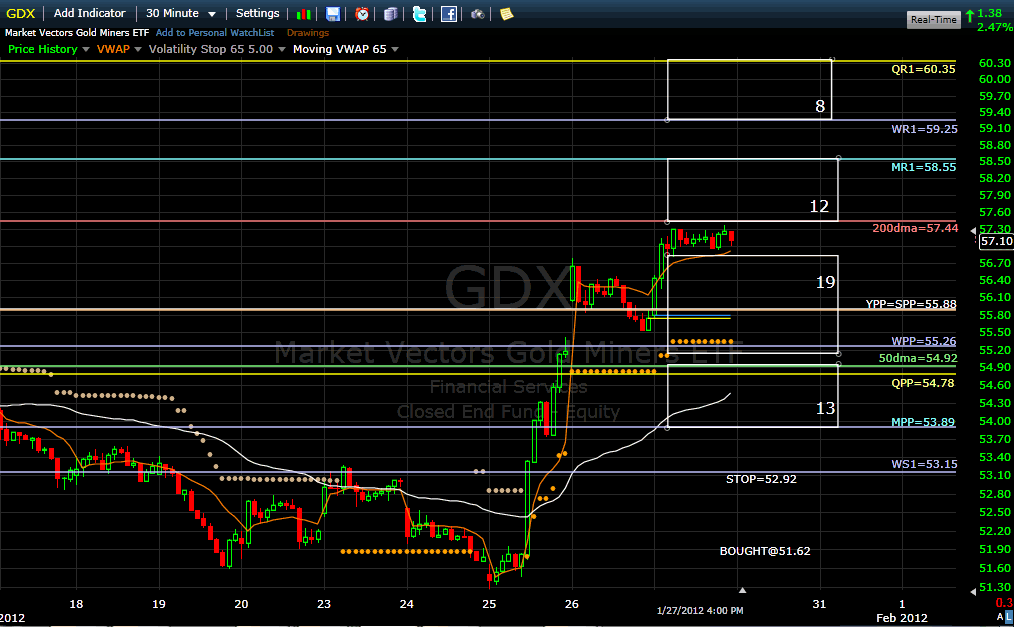
Besides the whole GDX robot strategy, the wisdom from that quote can hold true too for the current individual GDX trade. The initial trade was entered one month ago at 51.62,climbed 7.45% up to 55.45 on January 12 before falling back in the red as low as 51.27 on January 25, escaping the robot’s trailing stop by a few cents. Then, in only 2.5 trading days, GDX closed Friday up 10.69% from its initial entry price. The trailing stop is now raised 2.52% above entry to 52.92, providing a safe cushion in case of a catastrophe. The triple leverage NUGT is up 31.41% from entry. Not bad for a January return.
Trying to outsmart the robot strategy would have been almost impossible to do. The strategy was programmed to sell into strength beyond an overbought threshold that did not trigger on January 12. Many subscribers became nervous and eager to exit. But as I recalled here at the time, one of the major edges from the GDX robot strategy is that only 5% of the exits happen on a stop hit. The rational and logical mindset was to let GDX pullback, be patient and hold the position whatever the stress.
The overbought threshold has been exceeded for 2 days and the robot is now in a “sell into strength” countdown algorithm. With a GDX Money Flow at 1.83%, it is 1.59 day away from a sell signal.
The 200-day moving average (57.44) acts here as the strongest potential resistance, but the dual potential support from Yearly and Semester pivots (55.88) is actually twice stronger and much less obvious to the crowd’s eyes.

Really, “The whole process takes time – time for trades to develop, time for accounts to grow, and time to allow the strategy’s edge to work. The whole process is long, and at times very slow.”
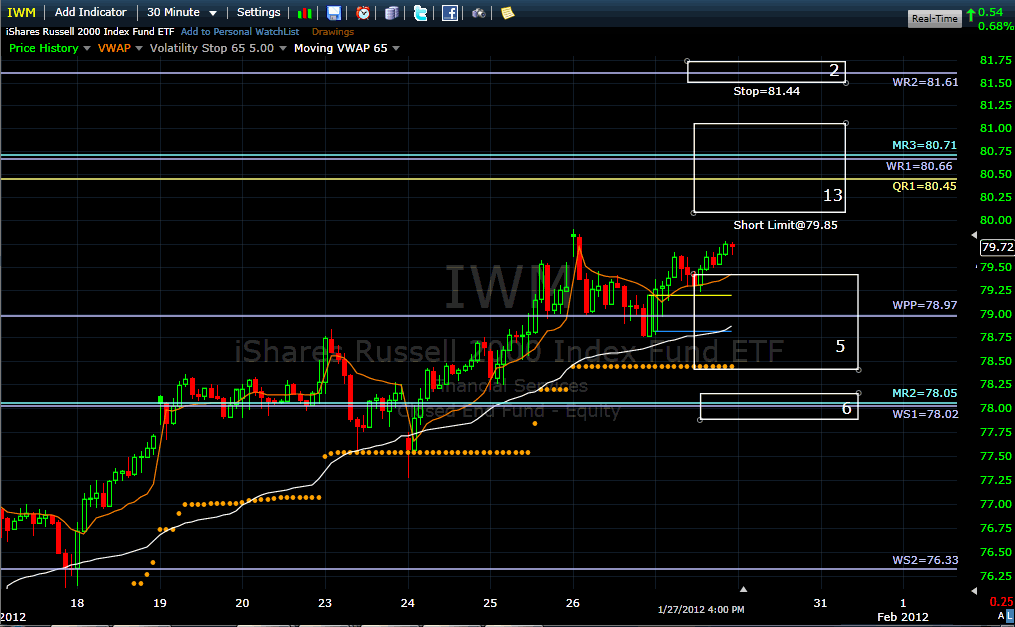
The IWM position looks prone indeed to command some patience too in the context of a general bullish risk-on enthusiasm. But the ST/LT settings edges for shorting are slowly and surely improving. And the extreme weakness of the 20 DMF on Friday’s close puts it nearer to a switch from neutral to short.
If you review the daily cluster charts for January, you’ll notice that resistance clusters are now getting much stronger than before for a tiring ETF. From a reward-risk analysis, the confluence of Quarterly R1 (80.45), Weekly R1 (80.66) and Monthly R3 (80.71) are more than what is needed for shorting at a limit of 79.85. The current stop at 81.44 allows for a lot of overshooting wiggle room while limiting the worst-case loss at 1.98% from initial entry.
Billy

 Posting Permissions
- You may not post new threads
- You may not post replies
- You may not post attachments
- You may not edit your posts
Forum Rules


 Reply With Quote