+ Reply to Thread
Page 1 of 2 1 2 LastLast
Results 1 to 10 of 14

Thread: Fail-Safe Or Not Fail-Safe? - January 26, 2012

  1. #1
    Join Date
    Dec 1969
    Location
    Brussels, Belgium
    Posts
    1,999

    Fail-Safe Or Not Fail-Safe? - January 26, 2012

    “All you need to know is the Fed wants to inflate prices of everything including stocks. Putting in place a “permanent” policy of low interest rates over the next several years will lead to a weak dollar and more inflation. That’s it. This generally means that market strategists and technicians need to yield to what the Fed is doing.” Dave Fry. ETF Digest.com

    Now, the problem is how can we let the IWM robot know about yielding to what the Fed is doing? And how could it precisely time and quantify it? This is of course an exogenous “subjective” element that could never have been included in the robot’s design and settings. At best, subjective influences like these, if we adhere to them, mean that we should reduce arbitrarily our position sizes for short trades. And that’s what I “subjectively” recommend indeed.

    There were frantic exchanges of emails this morning between Pascal and I when we saw that after being stopped out yesterday at 79.23, the IWM robot was again looking for a short entry at a limit of 79.85. We are not stupid and know that this uptrend is very powerful and dangerous for short-selling. The main problem with a neutral 20 DMF signal and a TEV that remains extremely extended is that the robot’s LT/ST settings will always look for shorting no matter how long the price uptrend continues. There is no fail-safe parachute.

    We were ready to introduce a new fail-safe trigger, but only after clear evidence from backtested statistical studies. And Pascal’s research is pointing to a favorable outcome if shorting into strength today or tomorrow.
    He found 28 cases with a MF > 0.83 for 12 days in a row with an IWM price advance over + 3.5%. The question is: under such conditions, did the ETF keep up-trending or did it pullback?


    On average, a higher close today is marking a top for the next 10 days with an average return of -2.61% within the next 10 days. A lower close today sees negative returns over the next 9 days with an average return of -0.96% after 10 days. If we have a higher close on Friday, the expected return would be – 1.00% within 10 days. If we have a lower close on Friday, then the expected return would be -2.5% within 10 days.

    Shorting into strength today or tomorrow has always been the correct decision in the past. Hence, no new fail-safe rule is justified and the robot will enter a short trade at its official limit of 79.85. The initial stop at 81.43 is above the strong cluster of Monthly R3 (80.71), Quarterly R1 (80.45) and Weekly R2 (80.01). Quarterly floor levels have marked many turning points in the history of the robot, so QR1 will be a key potential top to watch.

    Name:  iwm120126.gif
Views: 347
Size:  42.6 KB

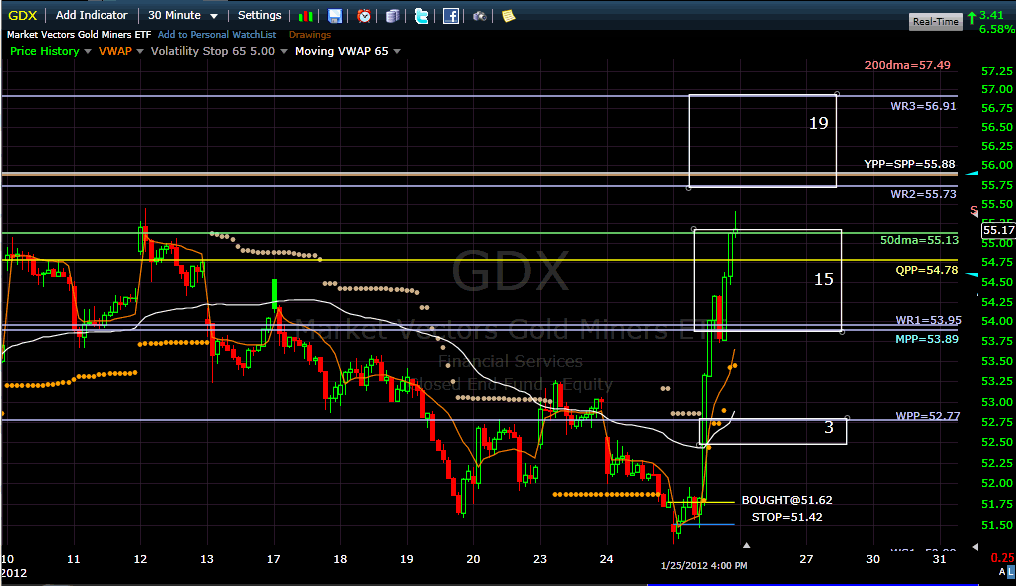
    GDX had its best day of the year and the GDX robot will sell its position if the GDX money flow closes back down below 1.35% as per the new improved rules. It currently sits at 1.86%.

    Name:  pmfff.gif
Views: 408
Size:  12.5 KB

    The stop can be trailed higher at 51.42, but with the new rule such a worst-case secenario is now extremely remote.
    Billy
    Name:  gdx120126.gif
Views: 405
Size:  44.7 KB
    Last edited by Pascal; 01-26-2012 at 07:57 AM. Reason: 1.35% instead of 1.30%

  2. #2
    Join Date
    May 2011
    Location
    South Florida
    Posts
    51
    Quote Originally Posted by Billy View Post
    The main problem with a neutral 20 DMF signal and a TEV that remains extremely extended is that the robot’s LT/ST settings will always look for shorting no matter how long the price uptrend continues. There is no fail-safe parachute.

    We were ready to introduce a new fail-safe trigger, but only after clear evidence from backtested statistical studies. And Pascal’s research is pointing to a favorable outcome if shorting into strength today or tomorrow.
    He found 28 cases with a MF > 0.83 for 12 days in a row with an IWM price advance over + 3.5%. The question is: under such conditions, did the ETF keep up-trending or did it pullback?

    On average, a higher close today is marking a top for the next 10 days with an average return of -2.61% within the next 10 days. A lower close today sees negative returns over the next 9 days with an average return of -0.96% after 10 days. If we have a higher close on Friday, the expected return would be – 1.00% within 10 days. If we have a lower close on Friday, then the expected return would be -2.5% within 10 days.
    Due to the sparsity of the historical data, I think it is important to not only look at the expected return but also at other statistical measures of the return distribution such as percentiles (or median and quartiles). As a side note, I assume that a parameter reduction to a single MF variable and IWM price advance threshold was necessary in order to produce a sufficient number of cases to examine.

    Trader D

  3. #3
    Join Date
    Oct 2011
    Location
    Brugge-Belgium
    Posts
    394
    I appreciate very much to work and the time you guys take to keep on improving the robot technology.
    Also a very warm “thank you” to you both for the answers that you both keep on deliver in these difficult times.
    I speak for myself as a novice trader: it is very hard to keep a positive mind after a series of negative trades.
    The statistics are in favor of these positive thoughts, so I will keep on going and give it my best.
    The most difficult part for me is the position sizing.
    I will follow the “subjective” advice from Billy and will start today with a quarter of my normal position size for a new limit short order, following the IWM robot.
    What (subjective?) guidelines should I follow to increase this initial position size, if the trade goes well?

    PdP

  4. #4
    Join Date
    Dec 1969
    Location
    Kalmthout, Belgium
    Posts
    35
    The issue as I understand it is that the 20DMF missed a buy signal late last year because conditions didn't reach the oversold level by a very small margin. What would the robot advise in case the 20DMF was on a long signal ?

  5. #5
    Quote Originally Posted by Rembert View Post
    The issue as I understand it is that the 20DMF missed a buy signal late last year because conditions didn't reach the oversold level by a very small margin. What would the robot advise in case the 20DMF was on a long signal ?
    I think that the Robot would be long from the 20DMF Buy signal date and would now have a neutral or even mixed setting, which means either keep its long position or sell it as the ST negative edges would be rather strong. I believe that the Robot would have a positive LT edge and a negative ST edge pushing it to the sidelines.


    Pascal

  6. #6
    Quote Originally Posted by Rembert View Post
    The issue as I understand it is that the 20DMF missed a buy signal late last year because conditions didn't reach the oversold level by a very small margin. What would the robot advise in case the 20DMF was on a long signal ?
    A short signal from the 20DMF would make it a confirmed trade.

    They key is the Euro/US$ relation. I will post updates on the EV web site of the Futures, which have been good at detecting changes. We now have a Euro short squeeze. This might last until tomorrow. If this last longer, then it means that maybe something significant is changing toward the US$ stance (stealth devaluation policy) and/or the Euro policy (All problems temporarily solved in the Euro zone.)


    Pascal

  7. #7
    Quote Originally Posted by TraderD View Post
    Due to the sparsity of the historical data, I think it is important to not only look at the expected return but also at other statistical measures of the return distribution such as percentiles (or median and quartiles). As a side note, I assume that a parameter reduction to a single MF variable and IWM price advance threshold was necessary in order to produce a sufficient number of cases to examine.

    Trader D
    Here is the data.
    I believe that if in three days, we did not hit the stop loss and IWM is closing higher than yesterday's close, we will not do better than a "wash" on the trade. At least this is what the stats says.

    In that case, we will refrain from trading new IWM Robots positions until the 20DMF issues a signal, because it means that past stats are not applicable and that the environment is on stealth QE3.


    Pascal

    Stats_1_26.xls

  8. #8
    Join Date
    May 2011
    Location
    South Florida
    Posts
    51
    Quote Originally Posted by Pascal View Post
    Here is the data.
    I believe that if in three days, we did not hit the stop loss and IWM is closing higher than yesterday's close, we will not do better than a "wash" on the trade. At least this is what the stats says.

    In that case, we will refrain from trading new IWM Robots positions until the 20DMF issues a signal, because it means that past stats are not applicable and that the environment is on stealth QE3.

    Pascal
    Attachment 12467
    Many thanks, Pascal, looking at the raw data is always best.

    Out of curiosity, if you were to look back at the market reversal that triggered at the "near miss" and assuming that we are indeed in a stealth QE environment, would you be able to trace its start (ie when those who move the market got the clue that QE3 is inevitable, whether formally announced or not) back to that date?

    Trader D

  9. #9
    Quote Originally Posted by TraderD View Post
    Many thanks, Pascal, looking at the raw data is always best.

    Out of curiosity, if you were to look back at the market reversal that triggered at the "near miss" and assuming that we are indeed in a stealth QE environment, would you be able to trace its start (ie when those who move the market got the clue that QE3 is inevitable, whether formally announced or not) back to that date?

    Trader D
    The rally started around Dec 19, which was an EOY Santa rally and nothing else.
    Then, the MF stayed very weak until Jan 18.
    So, I believe that if money started moving in, it was on Jan 18.
    However, nothing really impressive at that date: more like a "European no-bad-news" relief rally than anything else.

    Then, yesterday's announcement, which does not say clearly that we have QE3. However, zero interest rates implies QE3. So, we are trading this implication. However, we start to hear Obama talking about new taxes then next step might be spending cuts/protection against imports. These policies are also what is being pushed out in Europe.

    These policies will take a long time to be played out... Much longer than stealth printing. So the market is probably trading a short term event first.


    Pascal
    Last edited by Pascal; 01-26-2012 at 12:25 PM.

  10. #10
    Hi Billy,

    Pascal just sent out the 20DMF rt, which shows that no buyer is buying into the bounce. But the tick data shows that the tick is keep going up while the SPY price is going down since this morning. How do you interpret the tick divergence? (20DMF is for big buyer and tick is for market maker? and they disagree at the moment?)Name:  tick-2012-01-26.jpg
Views: 701
Size:  100.3 KB

+ Reply to Thread

Posting Permissions

  • You may not post new threads
  • You may not post replies
  • You may not post attachments
  • You may not edit your posts