-
No Apocalypse Yet December 13, 2011
Forum Clusters 111213.xlsx
Pre-FOMC selloffs have been pretty reliable buy points for a 1-2 day trade. Over the last 30 occurrences stretching back to the early 80′s, 26 (87%) led to a close above the setup days close either on the day of the Fed announcement or the following session vs. 66% random odds
Rennie Yang Markettells.com
The S&P was down 1.49% today. The last ten occasions the S&P started the December Opex Week off with a losing day, the remaining four days were net positive. On the four previous occasions where the Monday was down by more than 1%, the remaining four days were all up at least 2.22%. - Wayne Whaley
With the S&P 500 down on the 1st session of Decembers OpEx or FOMC week, the index had shown a remarkable positive performance over the course of the then following two weeks in the past. The S&P 500 closed at a higher level at the end of the week on two out of every three occurrences, and at the end of the then following week on 25 out of 29 occurrences (or 86.20% of the time). The index gained 1.0%+ until the end of the week and until the end of the then following week on 10 and 14 occurrences respectively, while closing lower 1.0%+ on 1 to 2 occurrences only (always compared to the S&P 500 close on the first session of the FOMC week). Although the markets prospect might not look very bright with the S&P 500 down -1.46% on the first session during an otherwise bullish seasonality, historically probabilities and odds are tilt in favor of higher prices and limited downside potential over the course of the next two weeks. Frank Tradingtheodds.com
Last week I made mention of the positive message from seeing the Russell 2000 Growth Index ranking higher than both of the Russell 1000 style indices in our four-period momentum ranking system. It is currently just behind the 2000 Value, but the real point is that small cap stocks are currently leading big cap stocks in that ranking system, and that is a bullish message.
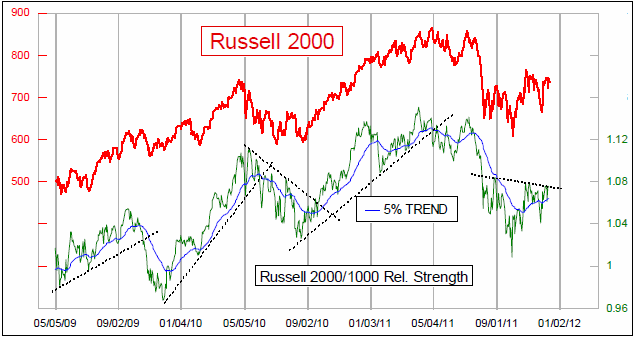
We see the same message in the top chart, which measures relative strength in a different way. The lower indicator in that chart is just the daily ratio of the Russell 2000 Index to the Russell 1000 Index. You calculate it by dividing one by the other. When it is moving upward, it says that the Russell 2000 is outperforming the 1000 on a relative basis, and that is usually a good sign for the overall market. Right now, this relative strength line is still above its 5% Trend, which is bullish, and it is threatening to break out above a shallow declining tops line. You can see from the other examples of trendlines drawn on this relative strength line that the breaking of these lines conveys an important message about trend change, quite often ahead of the equivalent line on the price plot being broken. Tom McClellan
I could continue the list of bullish conclusions by external independent quants forever as I could not find any bearish nor neutral quantitative (objective) conclusions for the short term outlook. Unless you are a schizophrenic contrarian in front of that unanimity, I wouldnt expect much weakness soon.
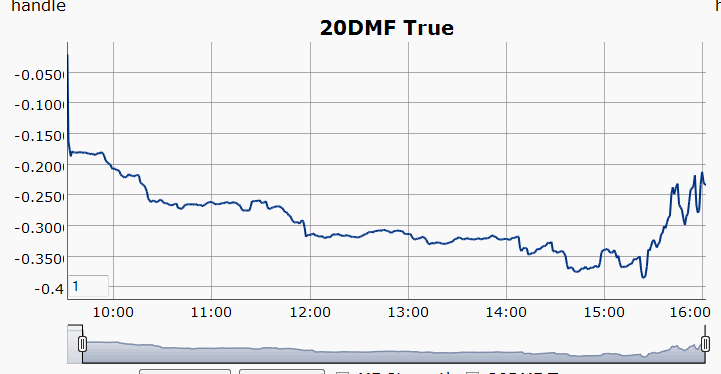
Both large players and market makers algorithms are acting on the same outlook. Large players RT 20 DMF strength finished the day net neutral (15% below average compared to 160% below average last Thursday) after aggressive buy programs were launched late in the session. There was no countertrend push at the close, contrary to all previous days.
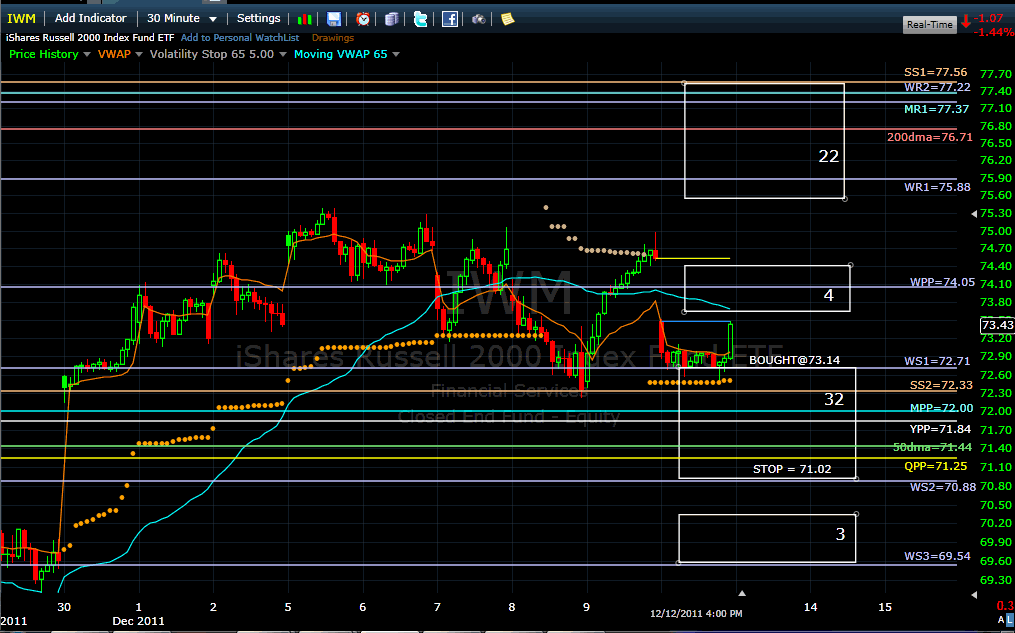
Market makers held Weekly S1 (72.71) as key support for rebuilding their inventories and sizing in at Mondays daily S1 (72.96) where intraday VWAP has been sitting most of the day. Buyers claimed their victory of the day by finally breaking the confluent VWAP and S1. This is a very bullish short term development and confirms that there are still significant bids and support just under the initial IWM robot entry at 73.14. Rebuilding inventory at Weekly S1 on a Monday usually sets a minimal target to Weekly R1 (75.88) at some time in the remainder of the week. This would imply that new highs and a potential first touch of the 200-day moving average (76.71) since last July are in the cards.
The next strong resistance cluster also starts at Weekly R1 (75.88) and the weekly pivot (74.05) offers little resistance power in-between. As usual, the market will likely wait for the FOMC announcement at 2:15PM at the intraday VWAP level. Anything can happen but I have a well-founded intuition of bearded Santa Ben offering us all a Merry and Profitable Christmas! If it is not the case, well hold the position until the stop (71.02) is hit or we have a robot signal change.
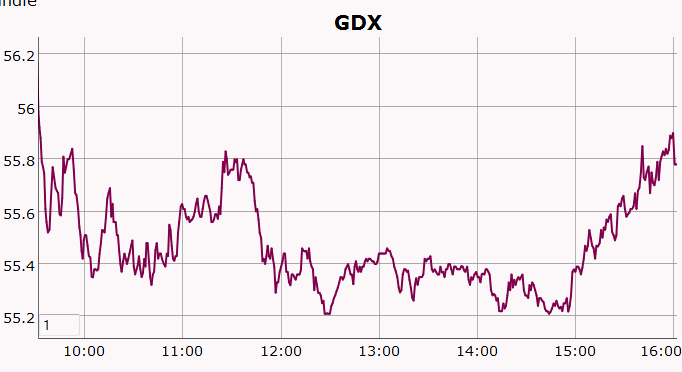
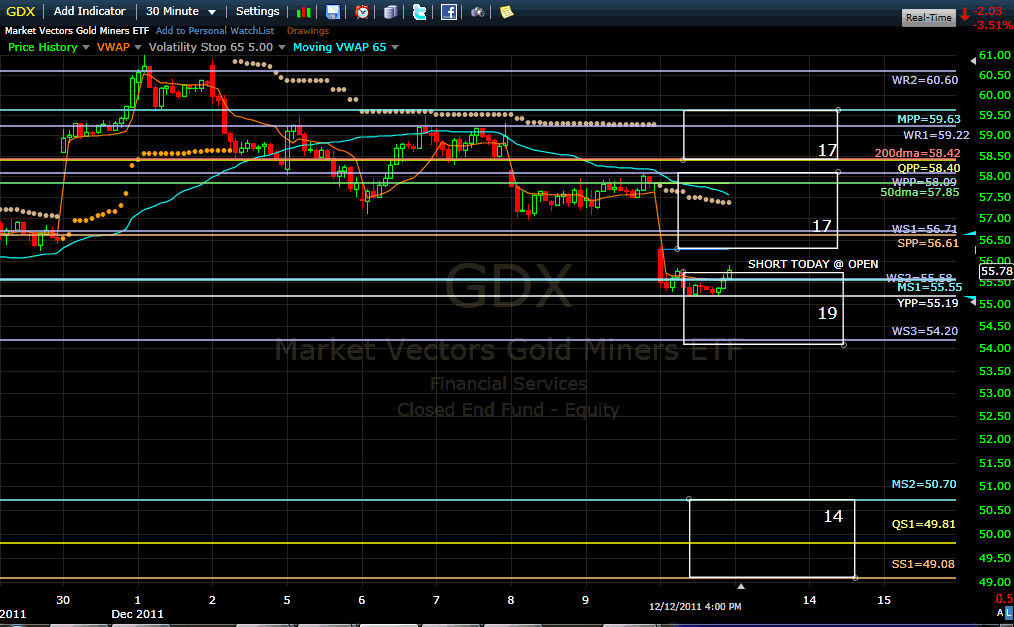
The new improved GDX robot triggered its first short trade setup today and will enter short at the open with an initial stop 7.72% above entry price. Since multi-pivots have not been helpful on an initial entry (but well on secondary entries) I will mostly let you read Pascals comments.
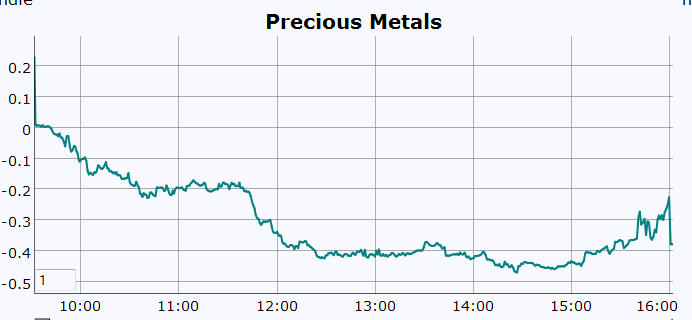
The Precious Metals Sector Money Flow was very weak on Monday and closed with a very strong negative divergence.
Id like to emphasize that a decisive breakdown below Yearly pivot (55.19) and Weekly S3 (54.20) has a good chance of cascading into a fast collapse down to the second support cluster starting at Monthly S2 (50.70).
Billy
 Posting Permissions
- You may not post new threads
- You may not post replies
- You may not post attachments
- You may not edit your posts
Forum Rules


 Reply With Quote