+ Reply to Thread
Page 1 of 3 1 3 LastLast
Results 1 to 10 of 26

Thread: Improving Market Structure - December 12, 2011

  1. #1
    Join Date
    Dec 1969
    Location
    Brussels, Belgium
    Posts
    1,999

    Improving Market Structure - December 12, 2011

    Forum Clusters 111212.xlsx

    IWM recovered most of Thursday’s pullback with a pocket pivot volume signature (volume higher than on any of the past ten days lower close). Friday’s RT 20DMF strength of large players was 99% above average and showed some weakness only in the last 30 minutes of profit-taking trading.

    Name:  209.gif
Views: 474
Size:  13.8 KB
    Name:  iwm9.gif
Views: 471
Size:  12.0 KB

    IBD’s Accumulation/Distribution ratings structure keeps improving on a weekly close basis. If 9% of all stocks are already under best accumulation with an A rating, 46% are rated with a B and it confirms widespread institutional support. These totaling 54% of stocks with strong accumulation/distribution ratings is an ideal backdrop for successful breakouts and emergence of strong leading stocks based on price-volume analysis alone.

    Name:  ibd.gif
Views: 469
Size:  35.9 KB

    On the price trend front, stage analysis remains our best guide. The percentage of stocks in weekly accumulation and mark-up stages closed above 50% for the first time since June 17 and is at a 26-week high with strong momentum. It means that a majority of stocks have now a positive alignment of their key moving averages on the weekly timeframe and the number is growing fast. This is most positive in the context of a consolidation week and shifts the intermediate term risk-reward ratio to the long side.

    Name:  %w.gif
Views: 468
Size:  42.7 KB
    Name:  %w2.gif
Views: 471
Size:  20.8 KB

    On the daily timeframe, the buy signal discussed last week remains fully valid and offers a good short term reward-risk outlook to the long side. The percentage of stocks in daily accumulation and mark-up stage is approaching fast the 50% threshold where price momentum to the upside can be expected as it would be coincident with a decisive crossing above the major indices’ 200-day moving averages.

    Name:  sd.gif
Views: 420
Size:  31.6 KB

    The long position of the IWM robot was entered at 73.14 in the lower end of the trading range and the optimal ATR-adjusted trailing stop (71.02) is just below the 50-day moving average (71.25). This new week will start with two strong floor support clusters totaling a strength of 36 (15+21). They are offering a positive reward-risk ratio compared to the first two floor resistance clusters with a strength of 30 (22 +8). But the first resistance cluster is stronger than the first support cluster with a ratio of 22 to 15 and some catalyst will be needed to make real progress. Such catalyst might come from the FOMC meeting on Tuesday or from any other macro news. Some initial weakness can be expected without such catalyst. The current robot settings are favoring holding the existing position with the active trailing stop but don’t find any edge for entering a new position on Monday. The 20 DMF remains in a buy signal since 11/28/2011 but is showing signs of fatigue in the commodities/energy/gold sectors. In conclusion, one or two strong days supported by large players are all that’s needed to propel the market much higher within very positive intermediate term outlook developments. Downside risk is bounded by the 50-day moving average.
    The GDX robot is in neutral settings and waiting for the next official trade setup.
    Billy
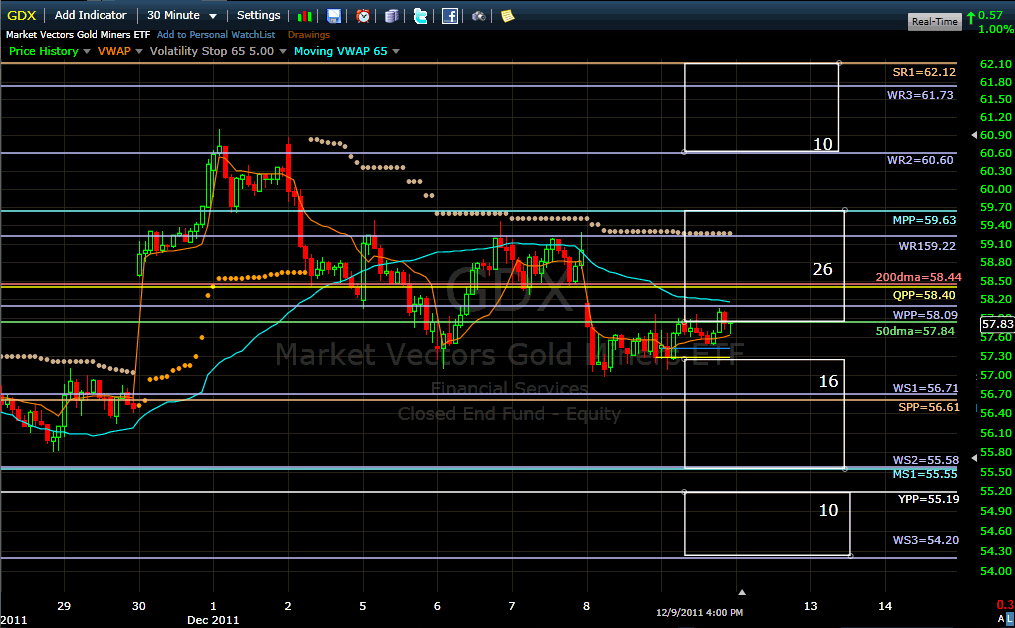
    Name:  iwm111212.gif
Views: 469
Size:  45.8 KB
    Name:  gdx111212.gif
Views: 467
Size:  46.0 KB

  2. #2
    Join Date
    Dec 1969
    Location
    Seattle, Washington USA
    Posts
    151

    pre-market futures pulling the price into buy range?

    It would seem that the market gods are giving us nervous bulls another good entry point.

    Name:  Capture.PNG
Views: 1047
Size:  148.6 KB

    Does anyone wish to shout out a louder than usual warning?

    Be well...

  3. #3
    Quote Originally Posted by nickola.pazderic View Post
    It would seem that the market gods are giving us nervous bulls another good entry point.

    Attachment 11844

    Does anyone wish to shout out a louder than usual warning?

    Be well...
    Hi Nickola,

    How would you analyse your emotional state at this moment in time :O)

    Trev

  4. #4
    Join Date
    Dec 1969
    Location
    Seattle, Washington USA
    Posts
    151

    hi Trev

    I went through EV/VIT archives and found you as one of the earliest posters.

    Emotional state? I'm a natural bear. So, naturally, I'm uncomfortable going long and always sell out of my positions too quickly.

    I'm delighted to have a re-entry permit. But I'm thinking seriously about slapping on a TZA hedge. We might trend down, down, down in a ring of fire.

    And you?
    Last edited by nickola.pazderic; 12-12-2011 at 10:05 AM.

  5. #5
    Join Date
    Dec 1969
    Location
    Vienna, Virginia
    Posts
    603
    I added a bit to my robot positions in IWM and TNA; still waiting for UWM ...

    Position size is small.

    Formula that I use which risk-adjusts based on ATR is:

    [ Account value * Pos'n Size ] / [ ATR(20) * Share Price ]

    So as volatility goes up, the amount you buy is dropping.

    Entry points are below the following:

    IWM:<73.17
    UWM: <33.75
    TNA: <45.20

    Regards,

    pgd

  6. #6
    Join Date
    Dec 1969
    Location
    Seattle, Washington USA
    Posts
    151

    question

    Paul,

    How do you determine the ATR? On which time frame?

    Thanks,

  7. #7
    Join Date
    Dec 1969
    Location
    Seattle, Washington USA
    Posts
    151

    idly looking at charts...

    We might go to 42.80 or so. Seems we've been there before:

    Name:  3.PNG
Views: 1028
Size:  111.2 KB

  8. #8
    Join Date
    Dec 1969
    Location
    Vienna, Virginia
    Posts
    603
    Quote Originally Posted by nickola.pazderic View Post
    Paul,

    How do you determine the ATR? On which time frame?

    Thanks,
    I use a 20d ATR which is updated intrabar.

    Regards,

    pgd

  9. #9
    Join Date
    Dec 1969
    Location
    Vienna, Virginia
    Posts
    603
    Quote Originally Posted by nickola.pazderic View Post
    But I'm thinking seriously about slapping on a TZA hedge.
    You may want to pick up some TZA for intraday hedge when it touches the VWAP from above.... Seems to be holding above intraday VWAP quite nicely.

  10. #10
    Join Date
    Dec 1969
    Location
    Brussels, Belgium
    Posts
    1,999
    Quote Originally Posted by nickola.pazderic View Post
    We might go to 42.80 or so. Seems we've been there before:

    Attachment 11846
    Nickola, please calm down and focus on the robot process. By entering the initial trade, you allowed for volatility down to the stop.
    Stop looking or nightmaring at your P&L is my most friendly advise at this point in time. Focus on the objective quality of the initial setup. The 20 dmf is still in buy mode and the settings are just neutral.
    Billy

+ Reply to Thread

Posting Permissions

  • You may not post new threads
  • You may not post replies
  • You may not post attachments
  • You may not edit your posts