-
Thank you Pascal for your responses (and Mike for the further question) , I did not realise that the sectors were evenly weighted for the 20DMF. I have been doing some EV calculations for the Australian market and as Mike mentions I found that the Large player strength of the ASX 20 looks the same as the Large player strength of the ASX 200 due to the market weightings based on each stock's market cap. Perhaps if I applied an equal weighting to each of the GICS Sectors and/or industry groups I would come up with a somewhat different picture.
Within this ASX 20 its pretty much Financials and Metals and Mining that make up the most of this. A very small market.
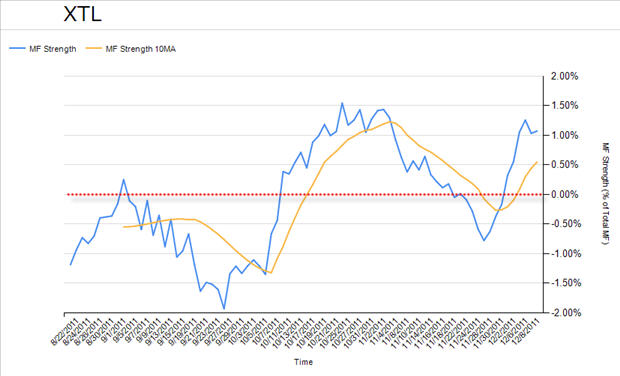
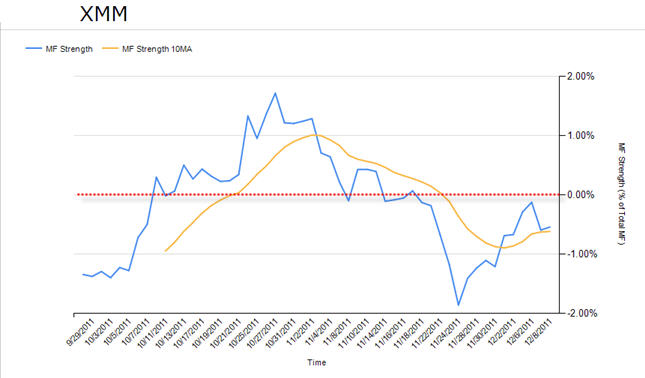
For what its worth I thought I might share the graphs of what I have come up with. The data is calculated minute by minute but I have only used the end of day values for the graphs. One is for the ASX 20 (XTL), the other for the Metals and Mining index (XMM). The dates only go as far as mid August for XTL and late September for XMM due to the time required to perform these calculations (as they rely on daily Large Player EV calculations for the required stocks, and my code is slow to do this :p). Also the 10 day average on the XTL graph up to the 4th Oct is not correct.
I think the Metals and Mining index looks a little similar to the Coal Sector LP strength for the same time period?
 Posting Permissions
- You may not post new threads
- You may not post replies
- You may not post attachments
- You may not edit your posts
Forum Rules


 Reply With Quote