-
Filters section
I received the following questions:
As relatively new subscriber I have few questions:
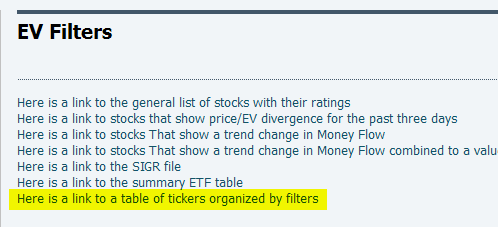
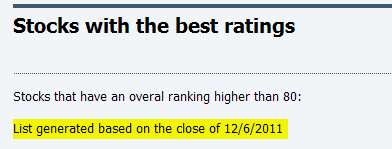
Info on : “Filters that include both Active Boundaries and Effective Volume” appear as charts for every category (e.g. “Stocks with the best ratings”)
Question 1: Is there a place it appears in an Excel format (I am interested first in the tickers that pass the specific filter).
Question 2: How often you update this data (it seems some are update daily and some are not).
Question 3: Per your experience, which 2-3 filters are the best to predict a potential Buy/sell tickers (assuming analysis was done separately for the general market trend-the most difficult task these days)
Q1: I added the list of tickers for each filter.

Q2: The data is updated daily about 6 hours before markets opens. The date of filter computation is indicated at the top of each filter page

Q3: It really depends on the market conditions. When to use each filter is stated at the right side of the table
I like to use filters to prepare for a market signal change.
For example, right now, I built a table of shorts candidates that could be actionable when the market turns to short.
Such a table includes the ticker, date of analysis, actual price, potential short price and a brief comment.
I mostly use the "Stocks with the best/worst ratings" when the market is trending, but the "Divergence with AB" filters to find weak stocks in a strong uptrend or the reverse.
Pascal
 Posting Permissions
- You may not post new threads
- You may not post replies
- You may not post attachments
- You may not edit your posts
Forum Rules


 Reply With Quote