+ Reply to Thread
Page 1 of 2 1 2 LastLast
Results 1 to 10 of 11

Thread: RT 20DMF Update

  1. #1
    Join Date
    Dec 1969
    Location
    Brussels, Belgium
    Posts
    1,999

    RT 20DMF Update

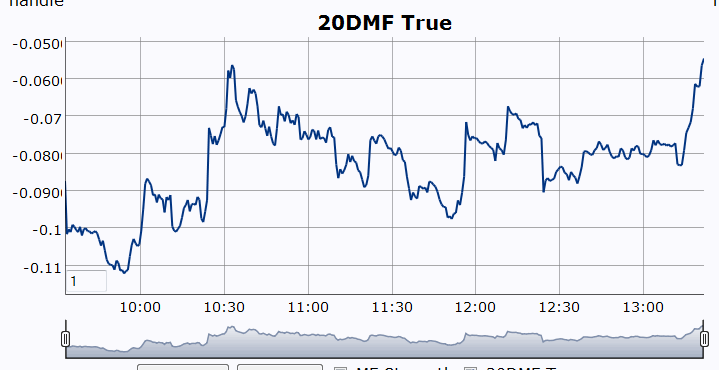
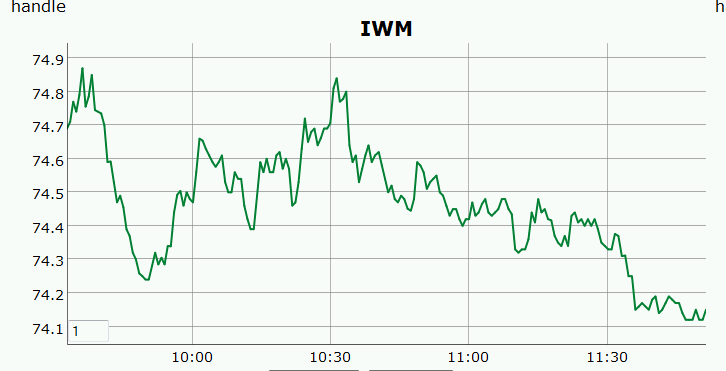
    While IWM and QQQ are dipping to daily S1, the RT 20 DMF is neutral with bullish divergences.
    Billy
    Name:  20r.gif
Views: 420
Size:  15.3 KB
    Name:  irt.gif
Views: 377
Size:  13.8 KB

  2. #2
    Join Date
    Jan 1970
    Location
    Victoria, BC, Canada
    Posts
    54
    Blly, Thank you for the intra day update. I'm having trouble seeing the bullish divergence you mention. From my novice point of view, it appears the RT 20 dmf follows the price action of IWM very closely. Divergences have always been a bit of a mistery to me. Just wondering if you could help me see the light? :-) Dave

  3. #3
    Join Date
    Dec 1969
    Location
    Brussels, Belgium
    Posts
    1,999
    Quote Originally Posted by davidallison@shaw.ca View Post
    Blly, Thank you for the intra day update. I'm having trouble seeing the bullish divergence you mention. From my novice point of view, it appears the RT 20 dmf follows the price action of IWM very closely. Divergences have always been a bit of a mistery to me. Just wondering if you could help me see the light? :-) Dave
    Look at the higher lows of the indicator vs. lower lows of IWM

    Large players are buying at S1.
    Billy
    Name:  rt.gif
Views: 415
Size:  13.2 KB
    Name:  it.gif
Views: 413
Size:  14.7 KB

  4. #4
    Join Date
    Dec 1969
    Location
    Brussels, Belgium
    Posts
    1,999

    New 20 dmf highs

    I like this RT technology!
    Billy

    Name:  n20.gif
Views: 927
Size:  18.3 KB

  5. #5
    Quote Originally Posted by Billy View Post
    I like this RT technology!
    Billy

    Attachment 11748
    Billy,
    Sure, it looks extraordinary fascinating. Have you and Pascal discussed on how to present this new technology? What actually can we use this tool for real time? Would it be just trial and error as we go along exploring a new tool? would it primarily be to exploit more advantaged entry exit trades? would you guide us in applying day trading using the tool?, etc. Just curious. best Sorensen.

  6. #6
    Join Date
    Dec 1969
    Location
    Seattle, Washington USA
    Posts
    151

    it seems to me...

    Name:  Capture.PNG
Views: 928
Size:  80.5 KB

    Three possibilities: If this trend line holds, we might see another pop today. Should it fail, the hawkers may (try to) take control. And yet, the price might stabilize here: where TOS puts IWM at the DPP.

    All (this analysis) is much more easy and smooth under the sure hands of Pascal and Billy, who have published very precise and useful notes today. Thanks....

  7. #7
    Join Date
    Dec 1969
    Location
    Brussels, Belgium
    Posts
    1,999
    Quote Originally Posted by sesorensen View Post
    Billy,
    Sure, it looks extraordinary fascinating. Have you and Pascal discussed on how to present this new technology? What actually can we use this tool for real time? Would it be just trial and error as we go along exploring a new tool? would it primarily be to exploit more advantaged entry exit trades? would you guide us in applying day trading using the tool?, etc. Just curious. best Sorensen.
    The ultimate objective is to develop a RT robot. We now have the capability of backtesting intraday patterns and behaviors of the RT 20DMF in relationship with risk-adjusted returns.
    It will take zillions of computations by Pascal to achieve that, but be assured that he will achieve it! In the meantime, trial-and-error plus a lot of common sense should help us improve our discretionary trades. Pascal and I will provide guidelines as we progress but we hope for observations and creative feedback by members once the new tool is online.
    Billy

  8. #8
    Join Date
    Dec 1969
    Location
    Brussels, Belgium
    Posts
    1,999
    Quote Originally Posted by nickola.pazderic View Post
    Attachment 11749

    Three possibilities: If this trend line holds, we might see another pop today. Should it fail, the hawkers may (try to) take control. And yet, the price might stabilize here: where TOS puts IWM at the DPP.

    All (this analysis) is much more easy and smooth under the sure hands of Pascal and Billy, who have published very precise and useful notes today. Thanks....
    Nickola,
    I am now operating under the assumption that this market has morphed from erratic into more predictable long term accumulation by large players. If they are in the middle of their accumulation programs as stage analysis suggests, they should close each day around intraday VWAP at worst with some porosity tolerance of course.
    I think that using such short term intraday support trendline as yours is focusing on noise and risking to let you miss the next big up moves in this transitioning market structure.
    Billy

  9. #9
    Join Date
    Dec 1969
    Location
    Seattle, Washington USA
    Posts
    151

    thanks

    As I was producing that chart, I had a general feeling of unease, as though much ado about nothing.

    I appreciate your feed back greatly. You've given me words to express why I was wrong.

  10. #10
    Billy,

    In the last 30 minutes of trading there was a sell-off. Did this change the picture on the 20DMF?

    Thanks

+ Reply to Thread

Posting Permissions

  • You may not post new threads
  • You may not post replies
  • You may not post attachments
  • You may not edit your posts