-
Bullish Clues - December 5, 2011
Forum Clusters 111205.xlsx
In easier, trending markets, mistakes are easily forgiven by Mr. Market. But those markets eventually morph into nastier ones, where there is much more of a premium placed on details and discipline. We all make bad trades and stray from our discipline at times. The key is quickly re-focusing and striving to improve. chessNwine ibankcoin.com
On Friday, the RT 20 DMF revealed relentless distribution by large players from 10:30 till the close with a net Money Flow strength dropping 116% below average for the day.
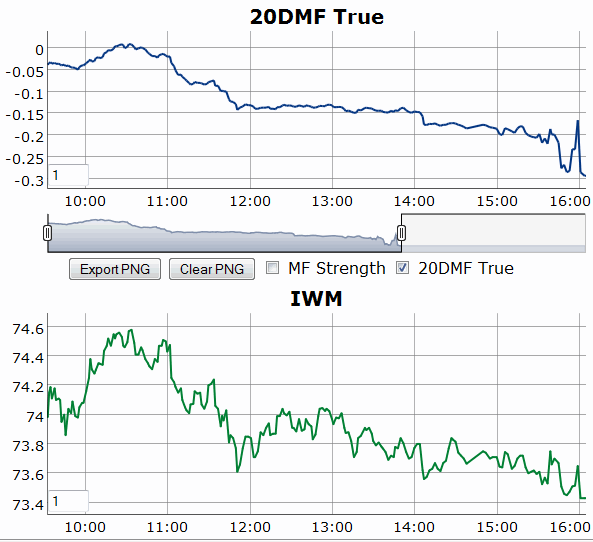
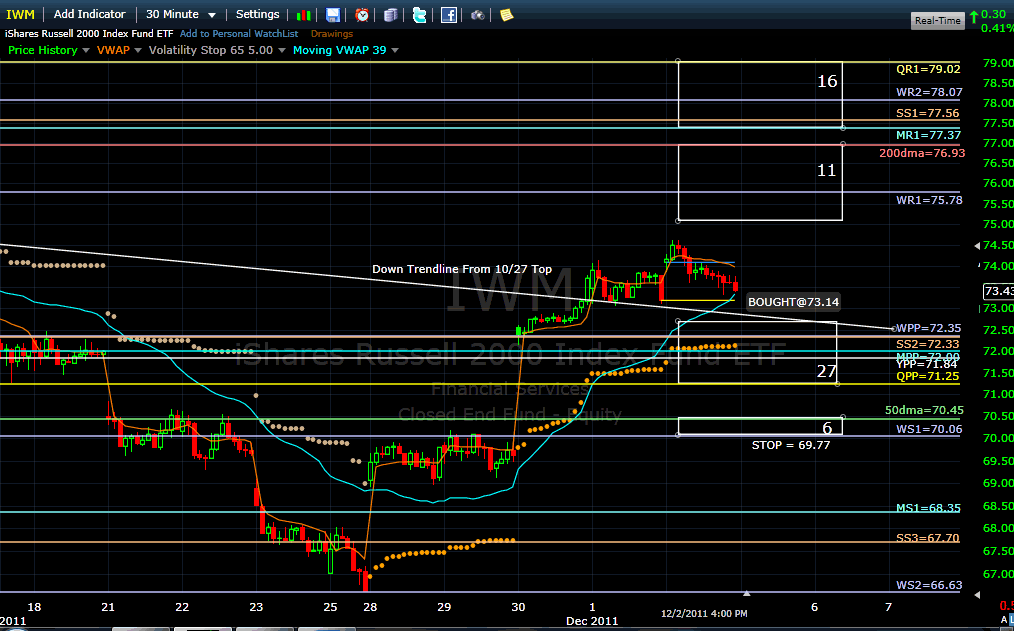
Such profit-taking before the weekend and after the best positive week since March 2009 was just normal around last weeks Weekly R3 (73.67). The magic of weekly pivots refreshing is that the old WR3 resistance has disappeared and a new Weekly pivot (72.35) has now appeared as fresh support. The first support cluster is remarkable as it includes 4 major pivot points (or timeframe equilibriums) : Weekly PP (72.35), Monthly PP (72.00), Yearly PP (71.84) and Quarterly PP (71.25). If large players remain bullish from here, this is an optimal scale-in and accumulation area for them for all timeframes horizons. Monitoring the beta RT 20 DMF will be our leading indicator this week and we are getting very close to making it available online for free to all dual robot subscribers.
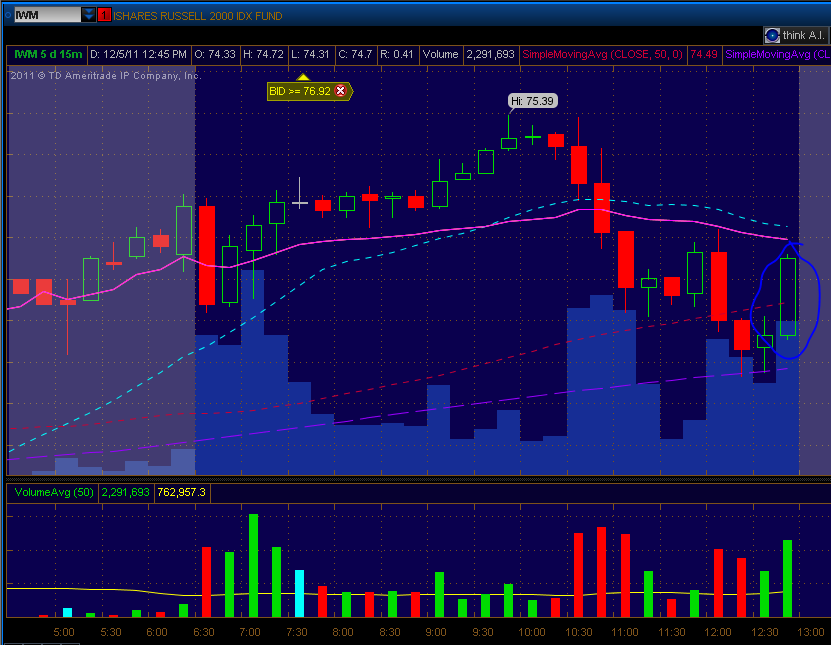
I see 4 other bullish clues in the chart above:
- A close right on the 3-day VWAP (blue line) which leaves the buyers from Wednesdays gap up open in control;
- The downward trendline resistance from the October 27th top seems to be conquered for good and a potential retest this week is converging to the Weekly pivot (72.35) at worst barring extraordinary surprise news.
- The first floor support cluster strength of 27 equals the total strength of the two resistance clusters (11 + 16). Quarterly R1 (79.02) becomes a very realistic target well above the 200-day moving average (76.93). Professionals and HFT floor levels reward-risk algorithms can only be strongly biased to the upside under such conditions.
- In spite of all recent big gaps, ATR volatility is dropping fast like it should do in an uptrend. This allowed the robot to trail its stop to 69.77 reducing much the worst-case risk on the current trade. Prices are likely to move in a more fluid manner making it easier to buy and sell IWM at the price we want.
But the robot settings for entering a new position on Monday are neutral. Again, this is not a sell signal for the existing position.
Billy
-
a wedging rally?
IWM seems to rally on a volume down slope. I wonder what the 20 DMF tells us about today's volume and close. This will be very interesting.
-
the market is giving us a signal
A rally into the close is encouraging to me, at least:
 Posting Permissions
- You may not post new threads
- You may not post replies
- You may not post attachments
- You may not edit your posts
Forum Rules


 Reply With Quote