Originally Posted by
mnoel

Thank you Mike for this analysis. I have a question with regard to the %E. Do you get this figure from the IBD site or MarketSmith?
Thanks in advance,
Martin
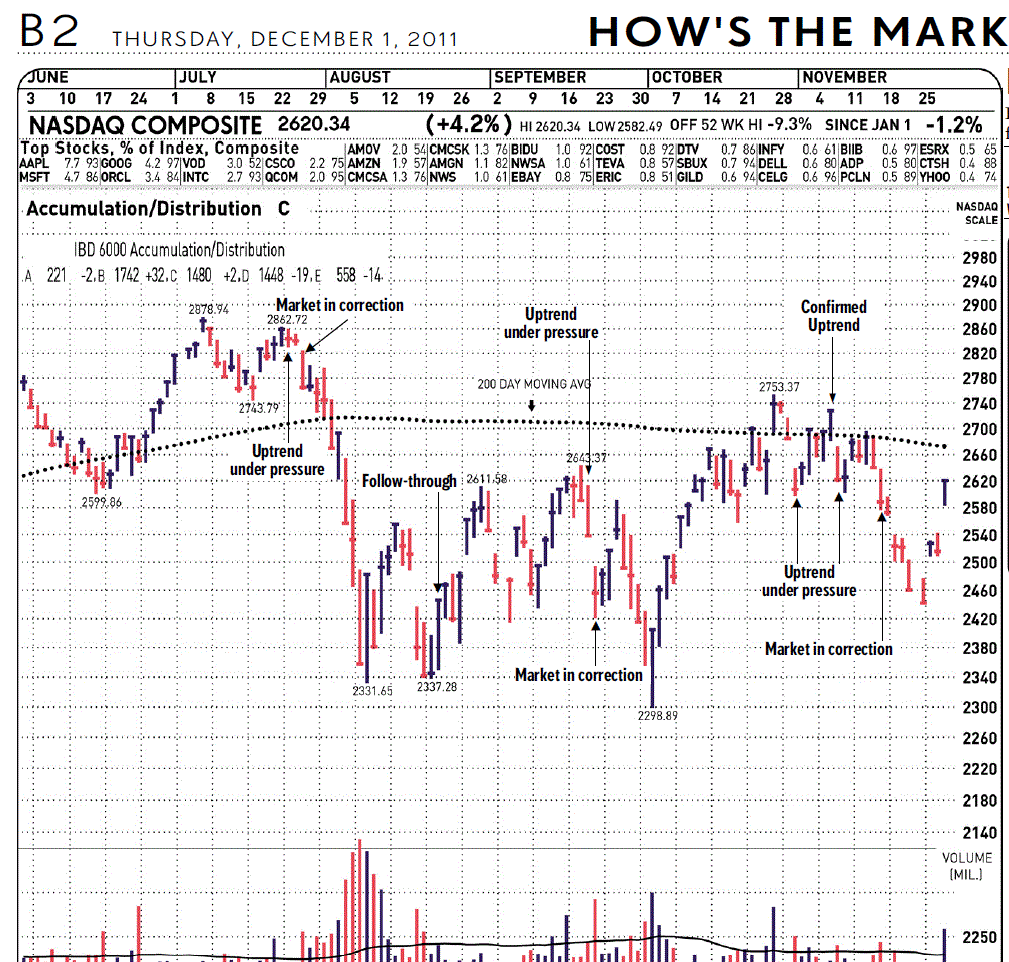
Martin, I get the data from IBD. It appears on the general markets page and is in every issue of IBD going back to October 1984 with a minor hole when IBD failed to print the index for a while.
I have attached an image here of the exact location of the data. The IBD 6000 index is all stocks in the IBD database above $5. It is a very broad US index. IBD tallies the accumulation/distribution rating for every stock in the index and prints the total numbers daily as an inset in the upper left corner of the NASDAQ chart. I simply divide the number of E rated stocks by the total number of stocks by summing A+B+C+D+E rated stocks and then multiply by 100 to convert to percent. I found through backtesting that 7.4% and above is where sustained rallies are born. Above 18% can be too much fear however. And of course nothing is perfect, exceptions occur but in general a little blood in the streets is good for the start of a rally.
I have looked at multiple ways of analyzing this data including %A-%E, (%A+%B)-(%D+%E), %A, %E as well as Billy's method = A*10 +B*7 + C*5 + D*3 + E*1. My coefficients may be off here. Ian Woodward also has tried a method with reverse waited coefficients to Billy's formula. Billy also developed a method to weight the S&P500 index with his Accumulation/Distribution score from his weighted A/D formula.
I back tested the %E as I found it simple and effective and a direct measure of the level of fear in the market. Ian's method accomplishes much the same thing.

Mike Scott
Cloverdale, CA


 Reply With Quote