+ Reply to Thread
Page 2 of 2 FirstFirst 1 2
Results 11 to 20 of 25

Thread: Buyers In Control - December 2, 2011

Hybrid View

  1. #1
    Join Date
    Dec 1969
    Location
    Brussels, Belgium
    Posts
    1,999
    Quote Originally Posted by jerpk View Post
    Billy--I don't understand how you determine the point from which you draw the fibonacci lines to determine your exit points. You mentioned a higher high and higher lows, but I see lots of them. Forgive the stupid question but I have a lot to learn! Thanks for all the great teaching on this site. Jerry Kuhn
    Jerry,
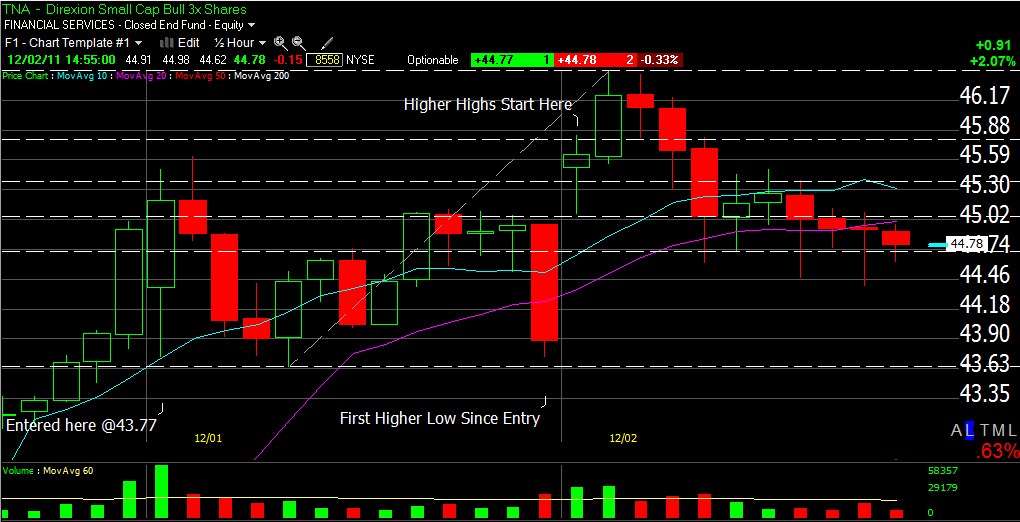
    I like to use the 30-minute chart highs and lows references. At the open today, we knew that yesterday’s close was the first higher low since entry and we had our higher highs. I draw the fib retracement up to the new highs and keep adjusting with additional new highs.
    Billy

    Name:  tna2.gif
Views: 356
Size:  24.2 KB

  2. #2
    Quote Originally Posted by Billy View Post
    Pierre,
    There are no position-sizing rules from the robot. All position-sizing and leverage decisions are your own responsibility.
    I previously gave an example of my own discretionary guidelines in the current conditions.
    First, I always enter a full TNA position at the initial limit, say 1,000 shares at 43.77 yesterday. I place my initial stop for 666 shares just under the first support cluster and for 334 shares at the robot’s stop.
    Once I see a higher low from my entry followed by higher highs, I exit 333 shares at a 39% retracement and 333 shares at a 51% retracement. The remaining 334 shares are managed exactly like a robot position.
    The proceeds of the 666 shares should only be reinvested at a robot’s entry limit if there are buy settings and the same stops and retracements guidelines apply from there.
    Today, 1/3 of my TNA (entered at 43.77) was stopped out at 45.29 and 1/3 at 44.99. I am still long 1/3 position but wont scale back-in my 2/3 position before a new active buy limit price.
    Billy
    Billy,
    I have three questions re your discretionary trading:

    1. In your Cluster Strength comment for IWM on 1. December 2011 you mention that “I place my initial stop for 666 shares just under the first support cluster”. You also mention a “massive floor support confluence from WR2 (72.26), MPP (72.00), YPP (71.84) and QPP (71.25)”

    From your IWM chart illustration the “just under” first cluster support would be between 71.90 and 72.00. This is about 1.55% below entry point. I assume that identifying the “just below” for the first cluster support level of the TNA will then be 3x1,55%=4.65% below 43.77, which is about 41.75. Is that a correct assessment of a TNA initial stop price “just below” first support cluster?

    2. One may also experience a lower high and a lower low scenario after a limit buy entry. Would you always stick to your initial stop (“just under the first support cluster”) or may exit if a lower-high, lower-low scenario occurs before hitting the initial stop?

    3. You also mention that these are discretionary guidelines as they apply to the current situation. Would you already now be able to hint other types of guidance applied for other market conditions? If not, we would all be very pleased to have you presenting them as they emerge. Thanks a lot. best Sorensen

  3. #3
    Join Date
    Dec 1969
    Location
    Brussels, Belgium
    Posts
    1,999
    Quote Originally Posted by sesorensen View Post
    Billy,
    I have three questions re your discretionary trading:

    1. In your Cluster Strength comment for IWM on 1. December 2011 you mention that “I place my initial stop for 666 shares just under the first support cluster”. You also mention a “massive floor support confluence from WR2 (72.26), MPP (72.00), YPP (71.84) and QPP (71.25)”

    From your IWM chart illustration the “just under” first cluster support would be between 71.90 and 72.00. This is about 1.55% below entry point. I assume that identifying the “just below” for the first cluster support level of the TNA will then be 3x1,55%=4.65% below 43.77, which is about 41.75. Is that a correct assessment of a TNA initial stop price “just below” first support cluster?
    I actually opted for an initial leverage stop reference at 71.80 because it was below the strongest support of YPP (71.84). That 71.84 stop was 1.83% away from the 73.14 reference entry level.
    Converting for TNA, the stop was 43.77 – (3x1.84% =5.50%) = 41.36.
    Note that I will only enter a hard stop order at 41.36 if I can’t be present at my desk. I will normally monitor the price/volume/TICK/RT 20DMF behavior of IWM at the yearly pivot (71.84) and sell TNA only once I see evidence that IWM is failing as support.

    [/QUOTE
    2. One may also experience a lower high and a lower low scenario after a limit buy entry. Would you always stick to your initial stop (“just under the first support cluster”) or may exit if a lower-high, lower-low scenario occurs before hitting the initial stop? [/QUOTE]

    That scenario happens quite often. As long as the robots daily settings remain on a buy signal, I will stick to my initial leverage stop and wait for the first higher low and higher highs on 30-minute bar charts.

    [/QUOTE]
    3. You also mention that these are discretionary guidelines as they apply to the current situation. Would you already now be able to hint other types of guidance applied for other market conditions? If not, we would all be very pleased to have you presenting them as they emerge. Thanks a lot. best Sorensen[/QUOTE]

    Yes, this is my favorite technique for choppy market/high volatility conditions only. The leveraged positions stopped out at a profit can often be re-entered at the recommended robot limit price. Sometimes several days in a row. Now, if volatility declines for long enough, and gaps/choppiness calm down, I would switch to trend-following or mean-reversion leverage risk management techniques. I think it is best that we wait for practical real-time opportunities to discuss these.
    Billy

  4. #4
    Billy, Pascal and Thanassis:

    In case I haven't said thank you lately, well, thank you.

    What a great education!

  5. #5
    Quote Originally Posted by Billy View Post
    I actually opted for an initial leverage stop reference at 71.80 because it was below the strongest support of YPP (71.84). That 71.84 stop was 1.83% away from the 73.14 reference entry level.
    Converting for TNA, the stop was 43.77 – (3x1.84% =5.50%) = 41.36.
    Note that I will only enter a hard stop order at 41.36 if I can’t be present at my desk. I will normally monitor the price/volume/TICK/RT 20DMF behavior of IWM at the yearly pivot (71.84) and sell TNA only once I see evidence that IWM is failing as support.

    [/QUOTE
    2. One may also experience a lower high and a lower low scenario after a limit buy entry. Would you always stick to your initial stop (“just under the first support cluster”) or may exit if a lower-high, lower-low scenario occurs before hitting the initial stop?
    That scenario happens quite often. As long as the robots daily settings remain on a buy signal, I will stick to my initial leverage stop and wait for the first higher low and higher highs on 30-minute bar charts.

    [/QUOTE]
    3. You also mention that these are discretionary guidelines as they apply to the current situation. Would you already now be able to hint other types of guidance applied for other market conditions? If not, we would all be very pleased to have you presenting them as they emerge. Thanks a lot. best Sorensen[/QUOTE]

    Yes, this is my favorite technique for choppy market/high volatility conditions only. The leveraged positions stopped out at a profit can often be re-entered at the recommended robot limit price. Sometimes several days in a row. Now, if volatility declines for long enough, and gaps/choppiness calm down, I would switch to trend-following or mean-reversion leverage risk management techniques. I think it is best that we wait for practical real-time opportunities to discuss these.
    Billy[/QUOTE]

    Thanks a lot Billy and Pascal. With Ilona and others i'd like to commend you all (incl. Eric, Bob, Mike, etc.) for your transparent and professional way of servicing us... It is really so different from other sites that claim to deliver the same... Sorensen.

  6. #6
    Join Date
    Jan 1970
    Location
    New York, NY
    Posts
    191

    How I am currently trading the robot

    I got the entry to the cent 73.14

    Sold last weeks 74 calls for 59ct credit
    rolled to this weeks 74 for $1 credit

    Today I bought the 74-72 put vertical for 62ct.

    So what can happen this Friday;

    a. We are above $74 -- I get assign on 74 -- making 74- 73.14 = 86ct+59ct+100ct-62 = 183ct or 2.5% for 8 days
    b. We are below $74 but above 72 -- I use the 74 put and sell the IWM for 74 and I will have the same result as under a.
    c. We are below 72 -- same result as under b. but I rebuy the IWM for 72 with the profit from b. I effectively own for 72-1.83 (I am getting close to break even considering the current Robot stop)

    Alternatively for B; I can sell the 74put, expire the 72 put and roll the short call to next week. This depending the DMF20 and my market "feel".

    Ernst

  7. #7
    Join Date
    Jan 1970
    Location
    New York, NY
    Posts
    191

    Still long IWM

    Quote Originally Posted by ernsttanaka View Post
    I got the entry to the cent 73.14

    Sold last weeks 74 calls for 59ct credit
    rolled to this weeks 74 for $1 credit

    Today I bought the 74-72 put vertical for 62ct.

    So what can happen this Friday;

    a. We are above $74 -- I get assign on 74 -- making 74- 73.14 = 86ct+59ct+100ct-62 = 183ct or 2.5% for 8 days
    b. We are below $74 but above 72 -- I use the 74 put and sell the IWM for 74 and I will have the same result as under a.
    c. We are below 72 -- same result as under b. but I rebuy the IWM for 72 with the profit from b. I effectively own for 72-1.83 (I am getting close to break even considering the current Robot stop)

    Alternatively for B; I can sell the 74put, expire the 72 put and roll the short call to next week. This depending the DMF20 and my market "feel".

    Ernst
    I ended up closing the vertical put 72/74 for 23ct credit and rolling the 74call for this week to next week for 1.18ct. So my new max profit if we stay above 74 is 183ct+23ct+118ct=324ct. Initial entry was per Robot 73.14+3.24 equals 76.38 and my current break even is 74-3.24 = 70.76

    The put vertical served its purpose - yesterday during the sell off - my IWM position was more or less flat for the day. So my 2yr old and I could spent some time in the Natural History Museum ;)

    BTW I still wish we had a TLT robot -- I "predict" the next significant trade-able trend will be short TLT.

  8. #8
    TLT's chart looks promising for a second leg down, but the MF chart looks very bullish though.

    Quote Originally Posted by ernsttanaka View Post
    I ended up closing the vertical put 72/74 for 23ct credit and rolling the 74call for this week to next week for 1.18ct. So my new max profit if we stay above 74 is 183ct+23ct+118ct=324ct. Initial entry was per Robot 73.14+3.24 equals 76.38 and my current break even is 74-3.24 = 70.76

    The put vertical served its purpose - yesterday during the sell off - my IWM position was more or less flat for the day. So my 2yr old and I could spent some time in the Natural History Museum ;)

    BTW I still wish we had a TLT robot -- I "predict" the next significant trade-able trend will be short TLT.

  9. #9
    Join Date
    Jan 1970
    Location
    New York, NY
    Posts
    191

    Tlt

    Quote Originally Posted by Wei View Post
    TLT's chart looks promising for a second leg down, but the MF chart looks very bullish though.
    When it comes to tlt and the other bond ETF's I don't think ETF volume is a tell-tale for what actually is happening. The bond futures and their derivatives are (I think) more products to watch. Let's not forget we are talking about a market with a couple of trillion in size and players like Bill Gross and Jeffery Gundlach - to name two biggies.

    I am very novice when it comes to interest rate trading - (read extreme novice), but I suspect that the EU will have kicked the can fare enough down the road that it has become invisible for some time. With the political system in the US in disarray till Jan 2013, I presume we will get an attack on the US bonds. Which other sandbox is available for our bond-vigilantes to play in.

    If my theory plays out -- then I see interest rate going up, USD going up!!!, SPX coming down.

  10. #10
    Join Date
    Jan 1970
    Location
    New York, NY
    Posts
    191

    close Robot IWM Long

    To finish up with my posts on the last Robot Long call -- I will need to update you on what I did last week.

    As we all did - I got stop out on the IWM stock @ 71.02, the short call 74 Dec were trading 7ct when I closed those.

    All in all $2.12 loss on the stock.
    and $2.31 profit on the options.

    I was of course not looking for 19ct profit - as we all I was looking for the start of the xmas rally. But overall a little profit for a trade that did not work out is great.

    For me this is one of the reason why I like to trade options when I engage in a direction trade.
    It allows me to express myself in a more diversified way then just long or short.

    To me it is important to always sell options or (kind of) never sell options on long stock. If you do it once in awhile you run the risk of have asymmetric results. You sold options when the stock really runs upwards and you limited your upside potential and you did not sell options when the trade falls apart giving you an outsize loss.

    Ernst

+ Reply to Thread

Posting Permissions

  • You may not post new threads
  • You may not post replies
  • You may not post attachments
  • You may not edit your posts