Yes Shawn, 30-minutes chart seems to work best.
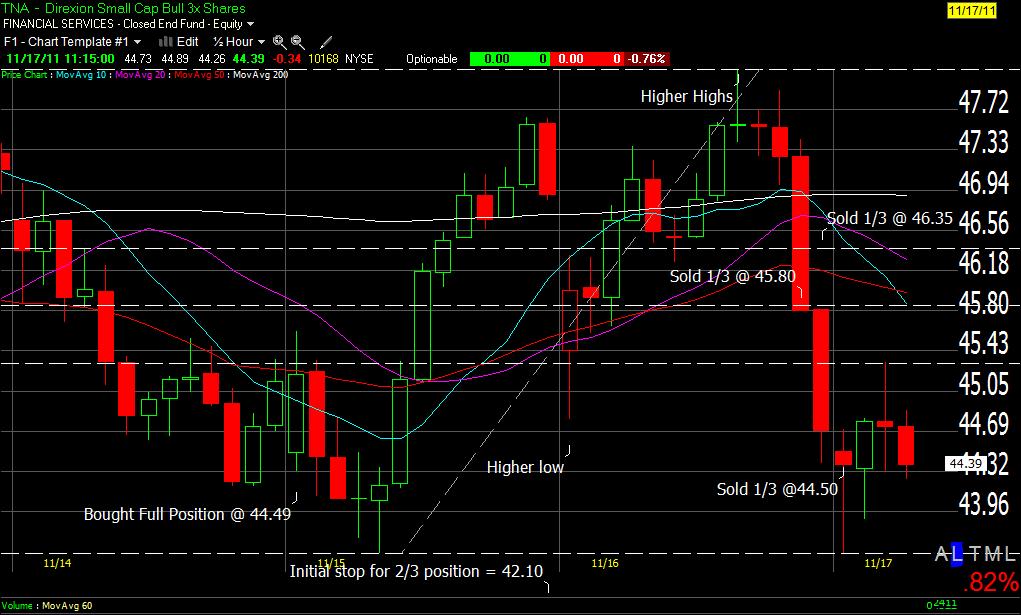
Here is what I did on the last long robot trade that lasted only 2 days (from open 11/15 to open11/17). It was basically a flat trade with the entry and the exit being only 1 cent away from each other.
But I could make a small + 2.38% gain scaling out of TNA as explained in my prior post.
Like the robot, I bought a full TNA position at the open at 44.49.
My stop on 1/3 of the position will always be the same as for the robot.
My initial stop on 2/3 of the position was 0.2% below the first support cluster at 42.10.
The stop is not hit. On 11/16 at 2:00 pm, the pattern of a higher low and higher highs is completed and I draw my Fibonacci grid. I enter hard stop orders for 1/3 position at 46.35 (39 % retracement) and 45.80 (51% retracement). They are hit before the close.
The last 1/3 position is exited with the robot signal change at the open the next morning on 11/17. If it had not been the case (no signal change), I would have entered a new limit buy order for the proceeds of the 2/3 position at the robot recommended price for 11/17.
Billy


 Reply With Quote