-
ETF Trading Rules
Hi to everyone,
I'm a member of this forum (and of the robot's) since 1½ months
Still trying to find my way around the enormous amount of information here to be found, I’m a bit confused on some of the EV trading rules
Since I try to focus on ETF’s only, I have searched the forum for a good explanation of the different columns in the pierre-etf file that is daily posted
I have found a pdf that contains the explanation of the ETF_repository file but still have questions:
• Am I correct to buy an ETF if the column D says “B” and value in the column B (Avg Tot EV) is as small as possible and the value in column C (Ext Tot Ev) is positive and above 10% ?
• Do I keep this ETF until the column D says “A” meaning that the Avg Tot Ev (column B) is above 50% ?
• How should I calculate my targets?
• How should I calculate a protective stop-loss?
Can anyone advice me?
Are there more documents to be found that include some basic trading rules for ETF’s using EV?
Greetings
PdP-Brugge
-
You need to be very cautious when using the TEV figures related to ETFs.
First, never rely on the strong TEV selling pattern of illiquid ETFs. These are often only the ETF managing bank providing liquidity. It does not mean that the ETF will go down.
Many ETFs are used to hedge positions. Therefore, strong ETF buying could indicate a selling wave in the equities.
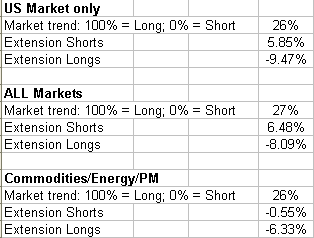
This is how I use this Pierre_ETF tabel:
I seldom use the different letters "B", "S" etc... on individual ETFs. However, I look every day at the summary table below. For example, today's table is rather bearish.

By experience, the most useful ETFs are the double inversed ETFs. I use the TEV extension of SKF, TWM, SDS and QID. These are the most traded inversed ETFs. I use them to confirm a short signal on the 20DMF. This means that large players are afraid of a downturn and are buying protection against their long position, while also selling some long positions. (The 20DMF sets the long term market direction)
Since you are following the IWM/GDX robots, you might have noted that there is a negative correlation between the TEV extension of these ETFs and the 3D price gain. This means that the robots are programmed to take advantage of short term "reversal to the means" patterns, which are detected by the TEV Extension and the short term price trend. This strategy is used for short term (3D) moves.
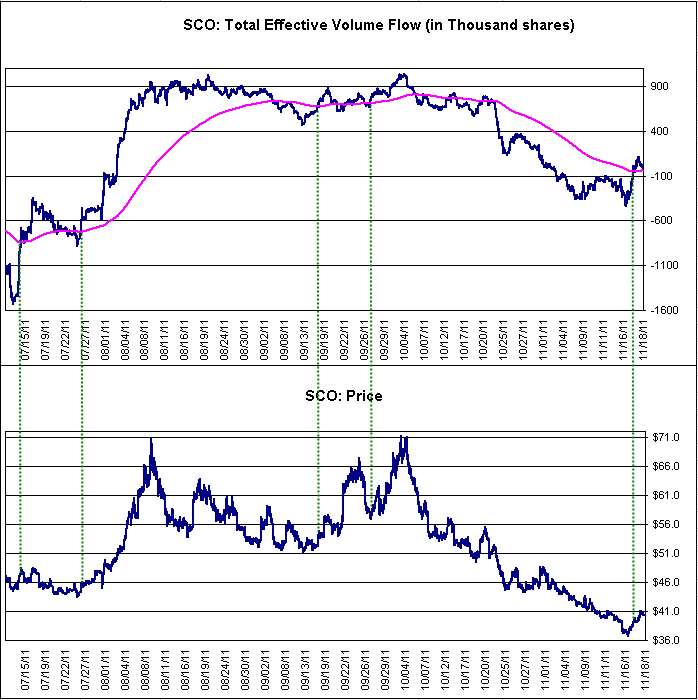
Finally, I have noticed many time that the TEV patterns on specific inversed ETFs work rather well: FXP for China, SMN for base metals and SCO for oil. I only use them to enter short positions, such as SCO on Friday. I will exit if the blue line falls back below the average.
Pascal

 Posting Permissions
- You may not post new threads
- You may not post replies
- You may not post attachments
- You may not edit your posts
Forum Rules


 Reply With Quote
