+ Reply to Thread
Results 1 to 9 of 9

Thread: Intra-Week Support and Resistance - November 7, 2011

  1. #1
    Join Date
    Dec 1969
    Location
    Brussels, Belgium
    Posts
    1,999

    Intra-Week Support and Resistance - November 7, 2011

    Forum Clusters 111107.xlsx

    Both robots are neutral and we still need to wait for strong signals before acting.

    The fresh IWM weekly pivot and floor levels will likely guide intra-week support and resistance without much impact from other timeframes. Indeed, it is a very rare occurrence when a new week starts with the 3:1 Reward/Risk optimal buy and short limit entries both coinciding exactly with weekly floor levels.

    If the IWM robot was not neutral, he would seek to enter long at the weekly pivot (73.67) or short at weekly R1 (76.37). So, the fresh weekly levels seem to have been targeted by large players’ reward/risk algorithms and this confirms that there is some credibility behind the multi-pivot methodology. In practice, in a neutral environment, since IWM traded only less than 10 minutes on low volume near 73.67 on Friday, we can expect an initial pullback to the same area, followed by a quick rally to WR1 (76.37) where profit-taking is likely to happen.

    If this set up is slightly bullish, it is certainly not indicative of long-term conviction by market makers who seem to restrict their inventory accumulation/distribution plans to the weekly timeframe. However, the long term path of least resistance is northward with a total floor resistance strength of 24 vs. a total floor support strength of 34. As long as quarterly (71.25) and yearly pivots (71.84) are not decisively breached, and barring catastrophic news, we can expect a market see-sawing its way higher on average.

    Name:  iwm111107.gif
Views: 351
Size:  47.6 KB

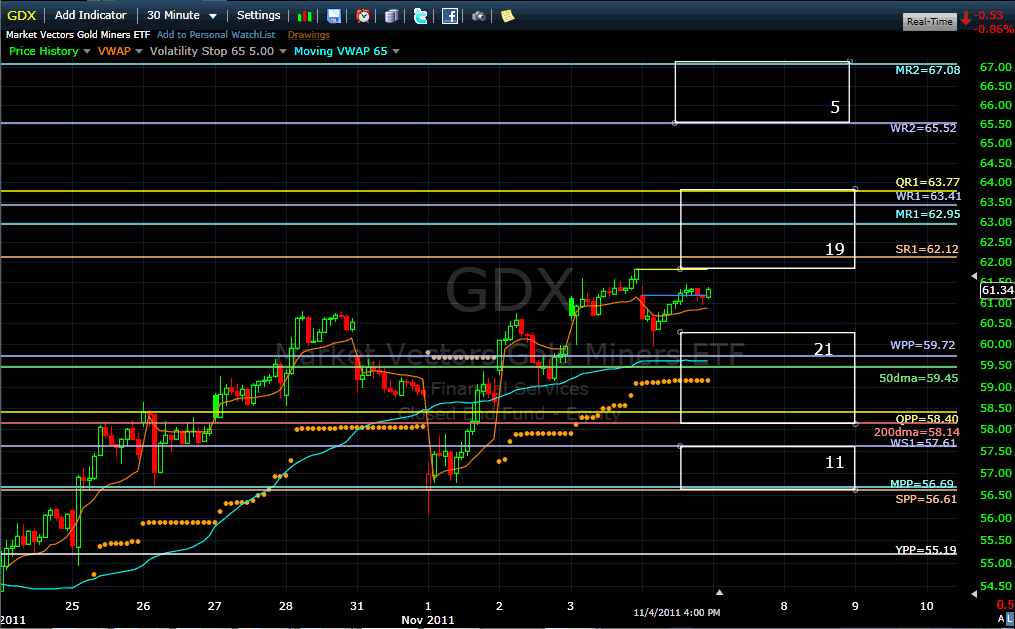
    For GDX, the multi-pivot path of least resistance is also northward with a total floor resistance strength of 24 vs. a total floor support strength of 32.
    Billy

    Name:  gdx111107.gif
Views: 307
Size:  44.4 KB

  2. #2
    Join Date
    Jun 2011
    Location
    HAILEY, ID., MESQUITE, NV.
    Posts
    39
    Good Morning Billy (or afternoon there),

    Have you written anything in the past regarding the calculations of the risk/reward ratio. I know there were some issues in the past with revealing your specific methodology but I'm not seeking your specific formula. Being a newbie, I just need some general guidance. The 3:1 ratio is referred to a lot. In my simple mind I think that means 3:1 potential profit to potential loss, or the ratio between profit target and entry and stop and entry. But, when I use the support and resistance lines, the entry points, the stops, etc., I never get even close to the numbers. For example on today's long entry (73.67), the stop is 4.58 below the entry number. The profit target appears to be at resistance (76.37). Therefore the potential profit is 2.70 (76.37-73.67). The result is a potential profit of 2.70 and a potential loss of 4.58. I know that is not correct. I've tried using the robot numbers for potential gain and risk but I still can't get anywhere close to a 3:1.

    I realize that this is an elementary trading question for you, but I have found nothing anywhere, internet, books or otherwise that really addresses this issue. All I see are statements like put your stop below yesterday's low, or below some multiple of the ATR, or at some risk level related to your total capital, etc. yada, yada, yada.

    At your convenience, I would sincerely appreciate at least some general enlightenment.
    Thank you,
    Buzz

  3. #3
    Join Date
    Dec 1969
    Location
    Brussels, Belgium
    Posts
    1,999
    Quote Originally Posted by buzzman View Post
    Good Morning Billy (or afternoon there),

    Have you written anything in the past regarding the calculations of the risk/reward ratio. I know there were some issues in the past with revealing your specific methodology but I'm not seeking your specific formula. Being a newbie, I just need some general guidance. The 3:1 ratio is referred to a lot. In my simple mind I think that means 3:1 potential profit to potential loss, or the ratio between profit target and entry and stop and entry. But, when I use the support and resistance lines, the entry points, the stops, etc., I never get even close to the numbers. For example on today's long entry (73.67), the stop is 4.58 below the entry number. The profit target appears to be at resistance (76.37). Therefore the potential profit is 2.70 (76.37-73.67). The result is a potential profit of 2.70 and a potential loss of 4.58. I know that is not correct. I've tried using the robot numbers for potential gain and risk but I still can't get anywhere close to a 3:1.

    I realize that this is an elementary trading question for you, but I have found nothing anywhere, internet, books or otherwise that really addresses this issue. All I see are statements like put your stop below yesterday's low, or below some multiple of the ATR, or at some risk level related to your total capital, etc. yada, yada, yada.

    At your convenience, I would sincerely appreciate at least some general enlightenment.
    Thank you,
    Buzz
    Buzz,
    The 3:1 reward/risk ratio to find the optimal multi-pivot limit entry is totally independent of the optimal (ATR-based) stop used by the robot to manage the risk of its positions.
    The multi-pivots methodology 3:1 RR ratio uses the strongest resistance and the strongest support in the first clusters as references. Today’s strongest resistance is the 200 dma (77.72) with a strength of 7 and the strongest support is SS2 (72.33) with a strength of 6.
    A long entry at 73.67 gives you (77.72 – 73.67 = ) $4.05 reward to the strongest resistance and (73.67 – 72.33 =) $1.34 risk to the strongest support. This is today’s multi-pivot 3:1 RR ratio for a long entry. I let you do the math for a short entry 3: 1 RR as an exercise.
    Billy

  4. #4
    Join Date
    Jun 2011
    Location
    HAILEY, ID., MESQUITE, NV.
    Posts
    39
    Billy, thank you. That is exactly what I needed. bz

  5. #5
    Join Date
    May 2011
    Location
    South Florida
    Posts
    51
    Quote Originally Posted by Billy View Post
    Buzz,
    The 3:1 reward/risk ratio to find the optimal multi-pivot limit entry is totally independent of the optimal (ATR-based) stop used by the robot to manage the risk of its positions.
    The multi-pivots methodology 3:1 RR ratio uses the strongest resistance and the strongest support in the first clusters as references. Today’s strongest resistance is the 200 dma (77.72) with a strength of 7 and the strongest support is SS2 (72.33) with a strength of 6.
    A long entry at 73.67 gives you (77.72 – 73.67 = ) $4.05 reward to the strongest resistance and (73.67 – 72.33 =) $1.34 risk to the strongest support. This is today’s multi-pivot 3:1 RR ratio for a long entry. I let you do the math for a short entry 3: 1 RR as an exercise.
    Billy
    Billy, based on your earlier comment ("The fresh IWM weekly pivot and floor levels will likely guide intra-week support and resistance without much impact from other timeframes."), I don't see why the RR ratio should necessarily use the SS2 & 200dma as sup/res references. In general, wouldn't the robot trade timeframe (whatever it is, since it's unknown) determine which pivots are the true references?

    Trader D

  6. #6
    Join Date
    Dec 1969
    Location
    Brussels, Belgium
    Posts
    1,999
    Quote Originally Posted by TraderD View Post
    Billy, based on your earlier comment ("The fresh IWM weekly pivot and floor levels will likely guide intra-week support and resistance without much impact from other timeframes."), I don't see why the RR ratio should necessarily use the SS2 & 200dma as sup/res references. In general, wouldn't the robot trade timeframe (whatever it is, since it's unknown) determine which pivots are the true references?

    Trader D
    The RR ratio doesn’t necessarily use the SS2 & 200dma as references. These are today’s references simply because they are the strongest levels within the first clusters. They are within reach of a one-day trading session volatility, based on ATR which is used as reference for defining the clusters width. The clusters widths and strongest supports and resistances within the first clusters are changing daily. (Note that there are some proprietary exceptions, but I won’t develop these).
    The robot has no timeframe constraints and will always enter at a 3:1 RR multi-timeframe limit. This is simply the logical conclusion drawn from backtesting for best risk-adjusted long term performance.
    Billy

  7. #7
    Join Date
    May 2011
    Location
    South Florida
    Posts
    51
    Quote Originally Posted by Billy View Post
    The RR ratio doesn’t necessarily use the SS2 & 200dma as references. These are today’s references simply because they are the strongest levels within the first clusters. They are within reach of a one-day trading session volatility, based on ATR which is used as reference for defining the clusters width. The clusters widths and strongest supports and resistances within the first clusters are changing daily. (Note that there are some proprietary exceptions, but I won’t develop these).
    The robot has no timeframe constraints and will always enter at a 3:1 RR multi-timeframe limit. This is simply the logical conclusion drawn from backtesting for best risk-adjusted long term performance.
    Billy
    Thank you for the enlighting answer, Billy. Is there a big difference if the strongest levels (within the first clusters, reachable with the defined volatility) happen to be daily or weekly pivots rather than, say, semester or annual? Wouldn't the RR be considered less reliable or at least render the trade to more likely be shorter-lived?

    Trader D

  8. #8
    Join Date
    Dec 1969
    Location
    Brussels, Belgium
    Posts
    1,999
    Quote Originally Posted by TraderD View Post
    Thank you for the enlighting answer, Billy. Is there a big difference if the strongest levels (within the first clusters, reachable with the defined volatility) happen to be daily or weekly pivots rather than, say, semester or annual? Wouldn't the RR be considered less reliable or at least render the trade to more likely be shorter-lived?

    Trader D
    Excellent question Trader D! Of course there is a big difference if the strongest levels are actually “weak” daily or weekly levels. And you are right, the RR ratio would be less reliable. This is actually when exceptions to the rule are necessary, but as I mentioned, they are proprietary.
    In such occurrences, robot subscribers can be assured that the optimal 3:1 RR entries have been adjusted according to the exception rules. These have been optimized by Pascal’s rigorous backtesting.
    Billy

  9. #9
    Join Date
    Dec 1969
    Location
    Seattle, Washington USA
    Posts
    151

    thanks

    Hi Billy,

    Thanks yet again for supplying clues about how professionals might trade IWM.

+ Reply to Thread

Posting Permissions

  • You may not post new threads
  • You may not post replies
  • You may not post attachments
  • You may not edit your posts