-
Mousetrap 11/6/2011
Secular Hold IAU XLV
Cyclical Target 940
Condition Bear Market Rally
Hedge XLU -2.32%
Position Date Return Days Call
SE 6/27/2011 10.85% 132 Hold
CLH 7/6/2011 6.88% 123 Hold
GCI 7/14/2011 -16.83% 115 Hold
GTAT 9/8/2011 -25.10% 59 Buy
CSGS 10/3/2011 19.09% 34 Hold
NLY 10/25/2011 -0.24% 12 Hold
DD 10/27/2011 0.70% 10 Hold
AMGN 10/27/2011 -4.78% 10 Hold
KBR 10/27/2011 -6.37% 10 Hold
VG 10/27/2011 -18.27% 10 Hold
Mousetrap Return 1.57%
S&P Return -6.84%
Hedged Return -1.95%
Mousetrap Annualized 3.61%
S&P Annualized -15.71%
Hedged Annualized -4.48%
Long Advantage 19.32%
Hedged Advantage 11.23%
Money flow indicates that strength will be in commodities, large cap, and multinational stocks.
Small cap, bonds, and utilities should underperform.
Although I am indeed short utilities, the question remains about my own portfolio. A good number of my fundamental selections have led me to small caps, and it may be that I have created a model that is susceptible to a value trap in which value stocks underperform (i.e. they are at a discount for a reason).
Beginning this week I plan to report the secular holds of IAU (gold) and XLV (healthcare services) against the fundamental hybrid model. If my guess is correct, simply holding XLV may very well outperform the individually selected stocks. If so, it may be that during a bear market it is best to simply hedge one sector stock against either another sector or the S&P itself. Time will tell. While I have backtested the technicals and tested the fundamentals in real time, I have not been able to backtest them both together, and this live portfolio is ITSELF that test.
Finally, to add to what I wrote in the paper regarding demographics, Ive created a graph showing an inflated birthrate against the S&P.
The birthrate data represents the birthrate plus 46 years, against an inflation rate of 2.9%, and multiplied against itself three times, with a divider of 576 to put it on the same scale as the S&P.
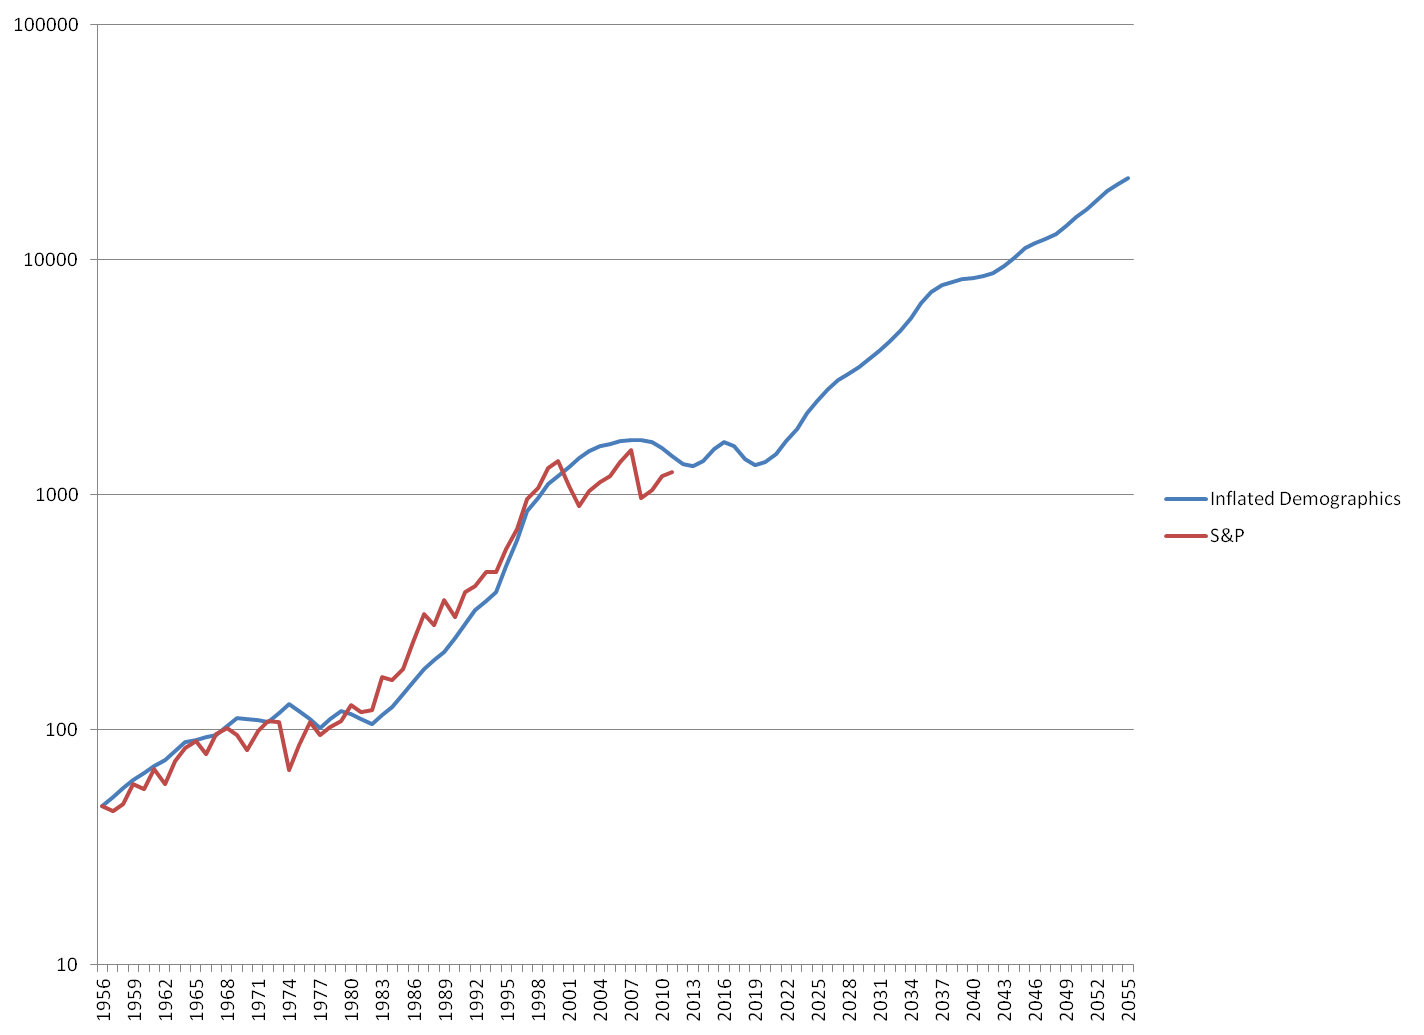
Using this scaling, barring any new technology, the S&P would be projected to remain in a trading range until 2020, with a failed breakout in 2013 to 2016.
Of course, anything could happen, and such a long range is not immediately tradable but it IS interesting.
Picking good companies in good sectors, however, will remain essential, as simply buying and holding the broad averages will likely lead to yet another lost decade.
The exception, of course, is gold and the current IAU hold is not likely to be changed for another 7 to 9 years.
Tim
Last edited by Timothy Clontz; 11-06-2011 at 01:40 PM.
-
Avoid diversified for now
No changes in my own indicators for the broad market, though I noticed the Diversified industry is diving off the cliff with money flow (i.e. too much divergence indicates a potential waterfall collapse).
I would avoid the following for the near future (no longs and no shorts):
WHR
NPK
MMM
HON
SXI
UTX
CHE
PH
CR
PKOH
KAI
KAMN
IR
BRC
AME
VMI
CSL
DHR
ESE
PNR
GY
TFX
SPW
GE
B
TXT
MYE
GMT
GFF
VVI
-
Accidental Market Timer
For what it's worth, my son woke me up at 2:30 last night, and by 4 I was tinkering with my model.
Wanted to check something out, and there was a factor in there that I didn't want, but I was too lazy to get rid of it, so I let it stay.
Then I noticed that it did something strange.
It could time the market.
Not perfect, of course, but in a simulation from 5 December 2003 to today, a 1000 investment using the timer just to go long or short the S&P would have a return of 3700 today.
It went long on August 18th and is still long. I'll include its reading as part of my Mousetrap updates in the future.
Not as good as the Robot, of course, but interesting to compare.
 Posting Permissions
- You may not post new threads
- You may not post replies
- You may not post attachments
- You may not edit your posts
Forum Rules


 Reply With Quote