+ Reply to Thread
Results 1 to 10 of 19

Thread: Lady Market and Intangibles – October 27, 2011

Hybrid View

  1. #1
    Quote Originally Posted by EB View Post
    Indeed, this looks like panic buying. 126.71 opened the year and fund managers want to close with what they perceive to be a central bank facilitated bang. One caveat is that, since the equities top, a gap open near daily R3 has been a sell signal. Conversely, if today's gains hold in the coming days, it could be a major risk-on indication.

    Attachment 11134
    I could not agree more. The 20DMF does not show money chasing high prices right now.
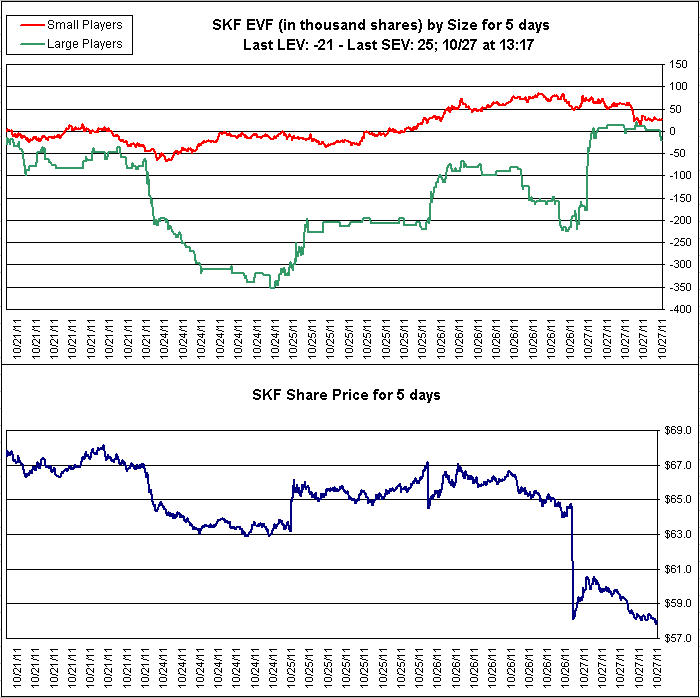
    Also, the inversed ETFs do not see money moving out (except for TWM).
    I believe that we are witnessing a Pavlovian reaction where traders think to be in the POMO days again.
    EV tells us the bounce is a fake.
    Sound trading says to wait for good settings, which are not here yet.
    Usually, large gaps are faded and this is what we are seeing today (not in terms of price, but in terms of MF.)
    Tomorrow will tell us what to do. I suspect a pull-back. If this pull-back is bought, then this "all clear" signal might have legs.


    Pascal
    Name:  TWM.gif
Views: 5783
Size:  15.7 KBName:  QID.gif
Views: 5821
Size:  17.0 KBName:  SMN.gif
Views: 5700
Size:  16.0 KBName:  SDS.gif
Views: 5740
Size:  16.4 KBName:  SKF.gif
Views: 5758
Size:  16.4 KB

  2. #2
    Join Date
    Dec 1969
    Location
    Seattle, Washington USA
    Posts
    151

    fascinating day

    This trending day is fascinating insofar as IWM has basically held the 20 MMA since 8:30AM PST.

    Name:  2.PNG
Views: 5958
Size:  70.1 KB

    Even the slightest pullback is bought; and yet, the money flow shows a different picture. Thanks Pascal.

  3. #3
    Quote Originally Posted by nickola.pazderic View Post
    This trending day is fascinating insofar as IWM has basically held the 20 MMA since 8:30AM PST.

    Attachment 11140

    Even the slightest pullback is bought; and yet, the money flow shows a different picture. Thanks Pascal.
    Only price counts to make money.
    A topping pattern will take time to form.
    As of now, big money does not chase this gap, but it could chase it in the next days.

    In other words, do not chase this up, but do not short either.

    Pascal

  4. #4
    Join Date
    Dec 1969
    Location
    Montreal Quebec Canada
    Posts
    55

    Please look at the Price charts

    Quote Originally Posted by Pascal View Post
    Only price counts to make money.
    A topping pattern will take time to form.
    As of now, big money does not chase this gap, but it could chase it in the next days.

    In other words, do not chase this up, but do not short either.

    Pascal
    I have been using P&F charts for over 30 years, a subject which is not discussed here very often. I believe in this approach to identify intermediate and long term trends. I would suggest that people take a look at most if not all recent P&F charts of North American indices Dow,S&P, Rut, NASDAQ, TSX and you will notice that the bearish resistance line has been BROKE UP which essentially means that the trend is now UP and thus shorting is not a very good idea as mentionned by Pascal.

    IMHO, buying the forth coming pullback is therefore the less risky trading plan.

    Pierre Brodeur

+ Reply to Thread

Posting Permissions

  • You may not post new threads
  • You may not post replies
  • You may not post attachments
  • You may not edit your posts