+ Reply to Thread
Page 1 of 2 1 2 LastLast
Results 1 to 10 of 12

Thread: Transitioning - October 25, 2011

  1. #1
    Join Date
    Dec 1969
    Location
    Brussels, Belgium
    Posts
    1,999

    Transitioning - October 25, 2011

    Forum Clusters 111025.xlsx

    The easy conquest of Monday’s strong first resistance cluster - including the yearly and quarterly pivots - is an extremely rare event and must be respected. It happened on rising volume with a strengthening 20 DMF and explosive relative strength. So, we know that large players are behind the move and most probably for the middle or long term horizon. Under such circumstances, the most overbought indicators are simply confirming a transition from mean-reversion behavior to long term trend following.

    Several leading component stocks of IWM were the targets of mergers and acquisitions, so it may have distorted the real strength of the ETF. But the fact that so many large companies are rushing to take over small companies on the same day, with the same timing, indicates that small caps are offering attractive value and that bidders are afraid to miss the opportunity of bargain prices. At least, we know that this is not short-squeezing, but the truest of all accumulations.

    A pullback is coming for sure, but it could happen after more momentum through the weak first resistance cluster. The optimal reward-risk multi-pivot sell or short entry (76.43) is now above weekly S3 (75.90), while the optimal buy entry (73.37) is just around yesterday’s close. These are just indicative guidelines for your discretionary trading because the IWM robot settings are still neutral.

    In case of a pullback starting today, as I wrote yesterday, the yearly pivot (71.84) and quarterly pivot (71.25) area should hold as major support just above last week’s range and breakout borders.

    Name:  iwm111025.gif
Views: 436
Size:  46.2 KB

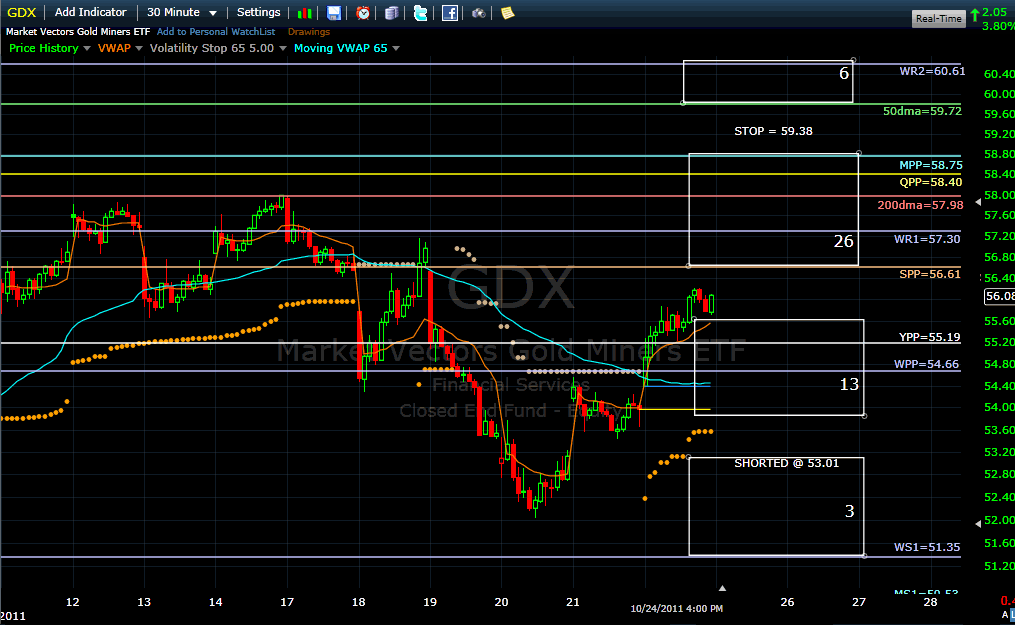
    While the robot doesn’t advise any new position, the GDX money flow remains on a sell signal and the ETF is still confronted with floor cluster resistances totaling twice as much the pressure (26 +6 =32) than the support clusters (13+3=16). The robot’s short position is now mid-way between the entry price (53.01) and the stop (59.38). Only a breakout above the 200-day moving average (57.98) would confirm a risk of hitting the stop soon.
    Billy
    Name:  gdx111025.gif
Views: 502
Size:  44.2 KB

  2. #2
    Join Date
    Dec 1969
    Location
    New Jersey
    Posts
    189
    Dear Billy and/or Pascal,

    Disclaimer - This question is not directly related to the Robot's current position, but rather an example of how to use the EV tools.

    When/if you get a free moment. I have been monitoring the GDX Robot position and honestly, from what I can infer using EV tools, it looks bullish (large player EV has been increasing, bounce off lower boundary, PM sector looks poised to break above 0 with one more positive day, etc). I know the GDX robot uses other tools (TEV extension, etc.) but I just wanted to ask if I am interpreting the EV tools correctly? If I was not a Robot subscriber, I would consider GDX a long candidate, am I reading the tea leaves properly? How do you interpret GDX this morning, ignoring the Robot?

    Of course, todays headlines, Europe, etc. can change everything.

    Thanks,
    Harry

  3. #3
    Quote Originally Posted by Harry View Post
    Dear Billy and/or Pascal,

    Disclaimer - This question is not directly related to the Robot's current position, but rather an example of how to use the EV tools.

    When/if you get a free moment. I have been monitoring the GDX Robot position and honestly, from what I can infer using EV tools, it looks bullish (large player EV has been increasing, bounce off lower boundary, PM sector looks poised to break above 0 with one more positive day, etc). I know the GDX robot uses other tools (TEV extension, etc.) but I just wanted to ask if I am interpreting the EV tools correctly? If I was not a Robot subscriber, I would consider GDX a long candidate, am I reading the tea leaves properly? How do you interpret GDX this morning, ignoring the Robot?

    Of course, todays headlines, Europe, etc. can change everything.

    Thanks,
    Harry
    The GDX Robot issued a short signal when the MG signal fell below the 0 level. The short position will be covered if we cross over the 0 level.

    The GDX Robot has not been programmed the usual way: it does not follow money blindly but fades large moves in the sector. You are right that the sector is forming a base and might attract money, but in the past days, it has been pulled by the general market. You can see that the average TEV extension on the sector was neggative as of yesterday.

    Today, with the fear of collapse in Europe, gold seems to attract "fear" money. We will see how the PM sector will react to this.


    Pascal

    Name:  Gold_sector.gif
Views: 467
Size:  12.5 KB

  4. #4
    Join Date
    Oct 2011
    Location
    Munich/Germany
    Posts
    0

    Quality of this rally

    Hello,

    I am a new subscriber and would like to get to know everything :)

    I became aware of your work through this article http://blog.alphascanner.com/

    Here it obviously states the opposite of what you said in your comments this morning about the qulaity of this rally and the article even mentions some of your work to substantiate its conclusions.

    I would be very grateful for a clarification on this matter.

    Thank you,
    Daniel from Hamburg

  5. #5
    Quote Originally Posted by dakuki View Post
    Hello,

    I am a new subscriber and would like to get to know everything :)

    I became aware of your work through this article http://blog.alphascanner.com/

    Here it obviously states the opposite of what you said in your comments this morning about the qulaity of this rally and the article even mentions some of your work to substantiate its conclusions.

    I would be very grateful for a clarification on this matter.

    Thank you,
    Daniel from Hamburg
    Can you be more specific? I do not understand your question.


    Pascal

  6. #6
    Join Date
    Dec 1969
    Location
    Seattle, Washington USA
    Posts
    151

    200 dma & gdx

    It seems to me that if the professional short sellers are to ride to the rescue, it would be right about now:

    Name:  2.PNG
Views: 414
Size:  58.3 KB
    Last edited by nickola.pazderic; 10-25-2011 at 03:39 PM.

  7. #7
    Join Date
    Oct 2011
    Location
    Munich/Germany
    Posts
    0

    Quality of this rally

    Quote Originally Posted by Pascal View Post
    Can you be more specific? I do not understand your question.


    Pascal
    Billy says in his morning comments that this rally has the feel of one where players are in for the long term, not just a short squeeze. The article I mentioned http://blog.alphascanner.com/
    however shows that this is not the case and it also uses your money flow indicator to substantiate its claims.

    This is off course a very important question for all of us to ultimately understand.

    Thank you
    (I have just subscribed to your daily comments too, Pascal, so I might get more understanding through that as well)

  8. #8
    Join Date
    Dec 1969
    Location
    Brussels, Belgium
    Posts
    1,999
    Quote Originally Posted by dakuki View Post
    Billy says in his morning comments that this rally has the feel of one where players are in for the long term, not just a short squeeze. The article I mentioned http://blog.alphascanner.com/
    however shows that this is not the case and it also uses your money flow indicator to substantiate its claims.

    This is off course a very important question for all of us to ultimately understand.

    Thank you
    (I have just subscribed to your daily comments too, Pascal, so I might get more understanding through that as well)
    Hello Daniel and welcome on board!


    Here was my conclusion from last weekend ‘s blog update:

    The daily stages score has turned positive last Friday for the first time since 7/26/2011 and it is a most optimistic development, with a positive divergence from price. But once again the transition is now overextended and looks unsustainable without a more constructive and orderly shake-out first.

    This is in line with the 20-day money flow indicator at www.effectivevolume.com which is on a buy signal since October 4 but now much overbought. The IWM robot, the mechanical and statistical system from the same website, is in cash as of today due to neutral risk-reward outlooks.”


    I see nothing contradictory with my Tuesday’s robot comments based on Monday’s impressive and exceptional action.
    Billy

  9. #9
    Join Date
    Dec 1969
    Location
    Long Island, New York
    Posts
    515

    Time frames

    I'd also like to add a caveat to be careful about time frames in different venues.

    Personally I see this as a bear market rally within a secular bear market, so...

    Sideways to 2017-2020
    Down to first quarter 2012
    Currently up, but overbought in last quarter 2011.

    Depending on the time frame I could theoretically be long or short the same position depending on how long I was planning to hold.

    Different comments you'll see here will reflect different time frames as well.

    Take XLF, quarter to year time frame might profit being short, while a two to three year time frame might profit being long.

    Week to month timeframe... I honestly have no idea (hence my eager subscription here).

    Just keep in mind the holding windows reflected in the comments you read...

    Tim

  10. #10
    Join Date
    Oct 2011
    Location
    Munich/Germany
    Posts
    0

    quality of this rally

    Quote Originally Posted by Billy View Post
    Hello Daniel and welcome on board!


    Here was my conclusion from last weekend ‘s blog update:

    The daily stages score has turned positive last Friday for the first time since 7/26/2011 and it is a most optimistic development, with a positive divergence from price. But once again the transition is now overextended and looks unsustainable without a more constructive and orderly shake-out first.

    This is in line with the 20-day money flow indicator at www.effectivevolume.com which is on a buy signal since October 4 but now much overbought. The IWM robot, the mechanical and statistical system from the same website, is in cash as of today due to neutral risk-reward outlooks.”


    I see nothing contradictory with my Tuesday’s robot comments based on Monday’s impressive and exceptional action.
    Billy
    Guten Morgen Billy,

    But in the article it is also written that ''a very negative long-term breadth development that doesn’t bode well for a sustainable rally.''

    It still isnt clear to me. Did Mondays developments than override the concerns mentioned in the article?

    Thank you
    Daniel

+ Reply to Thread

Posting Permissions

  • You may not post new threads
  • You may not post replies
  • You may not post attachments
  • You may not edit your posts