-
Update for Wednesday, October 26th
I was away Tuesday morning from the PC so I was not able to pay attention to the $TICK patterns as I usually do during the normal day. Of course, life got interesting almost out of the starting blocks:
As with all my images, right click on the figure to open in a new window or tab.
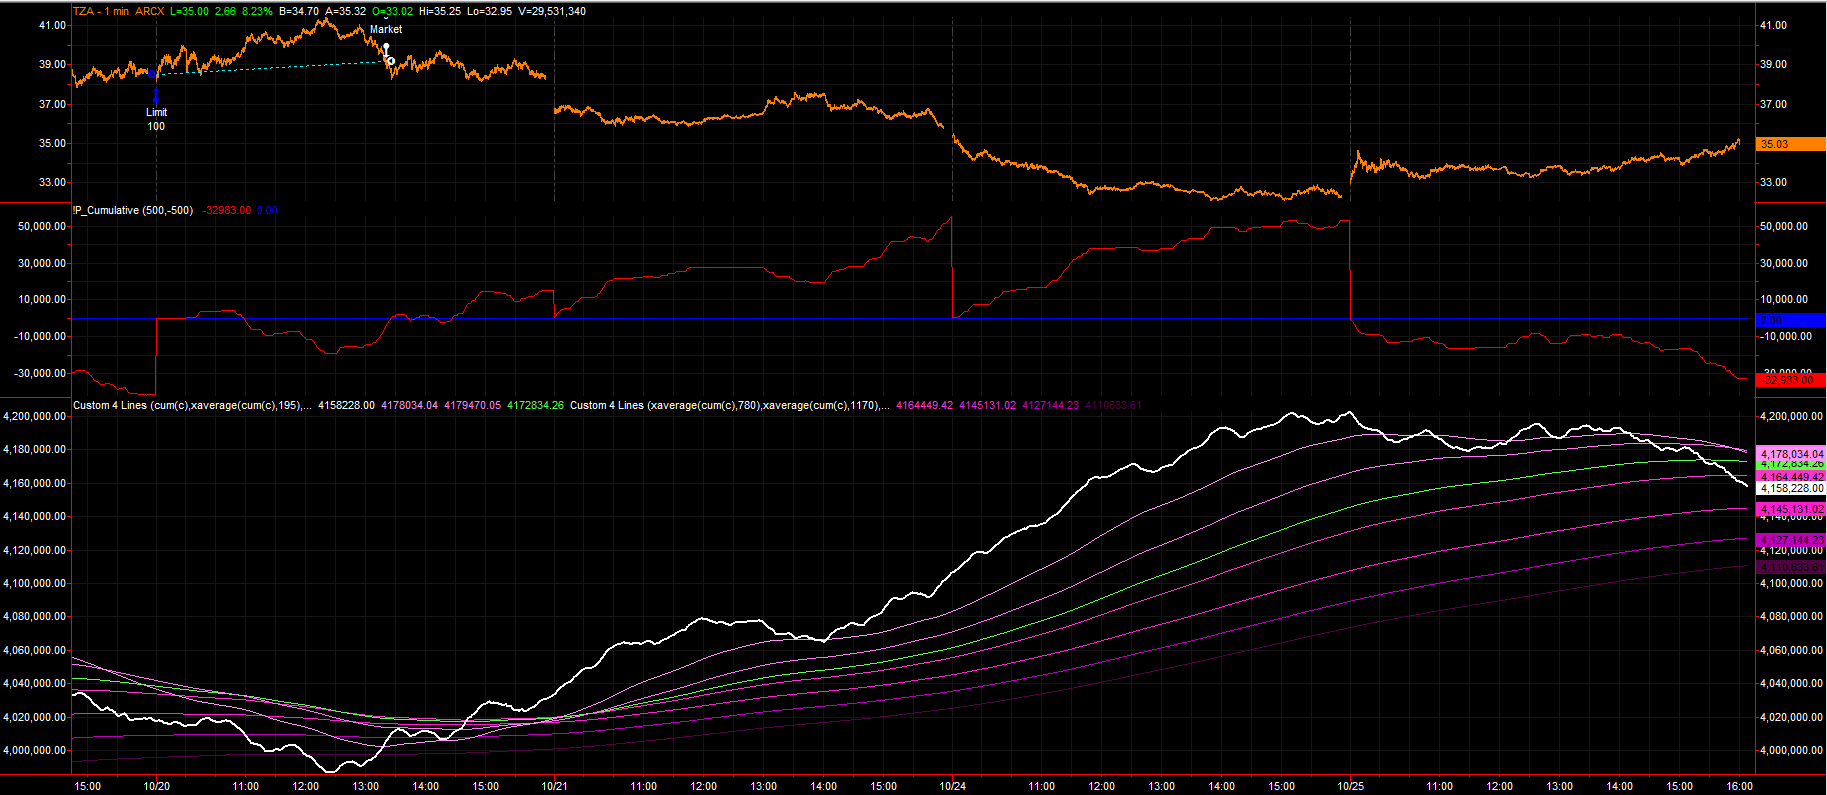
This is the cumulative $TICK, and the middle plot is a filtered 500 stock/min accumulator that only moves if there is strong buying/selling during that interval. We started moving down right away, which is unusual -- as we often wait until about 9:50 to see movement one way or another. This is a generalization and is not to be taken as gospel.
TZA, the levered -3x ETF on the Russell 2000, is shown in the top. Note that my automated buying algo did not kick in today despite the downward pressure at the end of the day. What the lower pane shows you is that while we did sell off with news at the end of the day, in general, the damage was not nearly as bad as it could have been throughout the day. We need a few more of those MAs to cross from above before I'll move to the bearish side with a long position in TZA.
This next set of views shows that the damage was more severe to the stocks on the individual indexes:
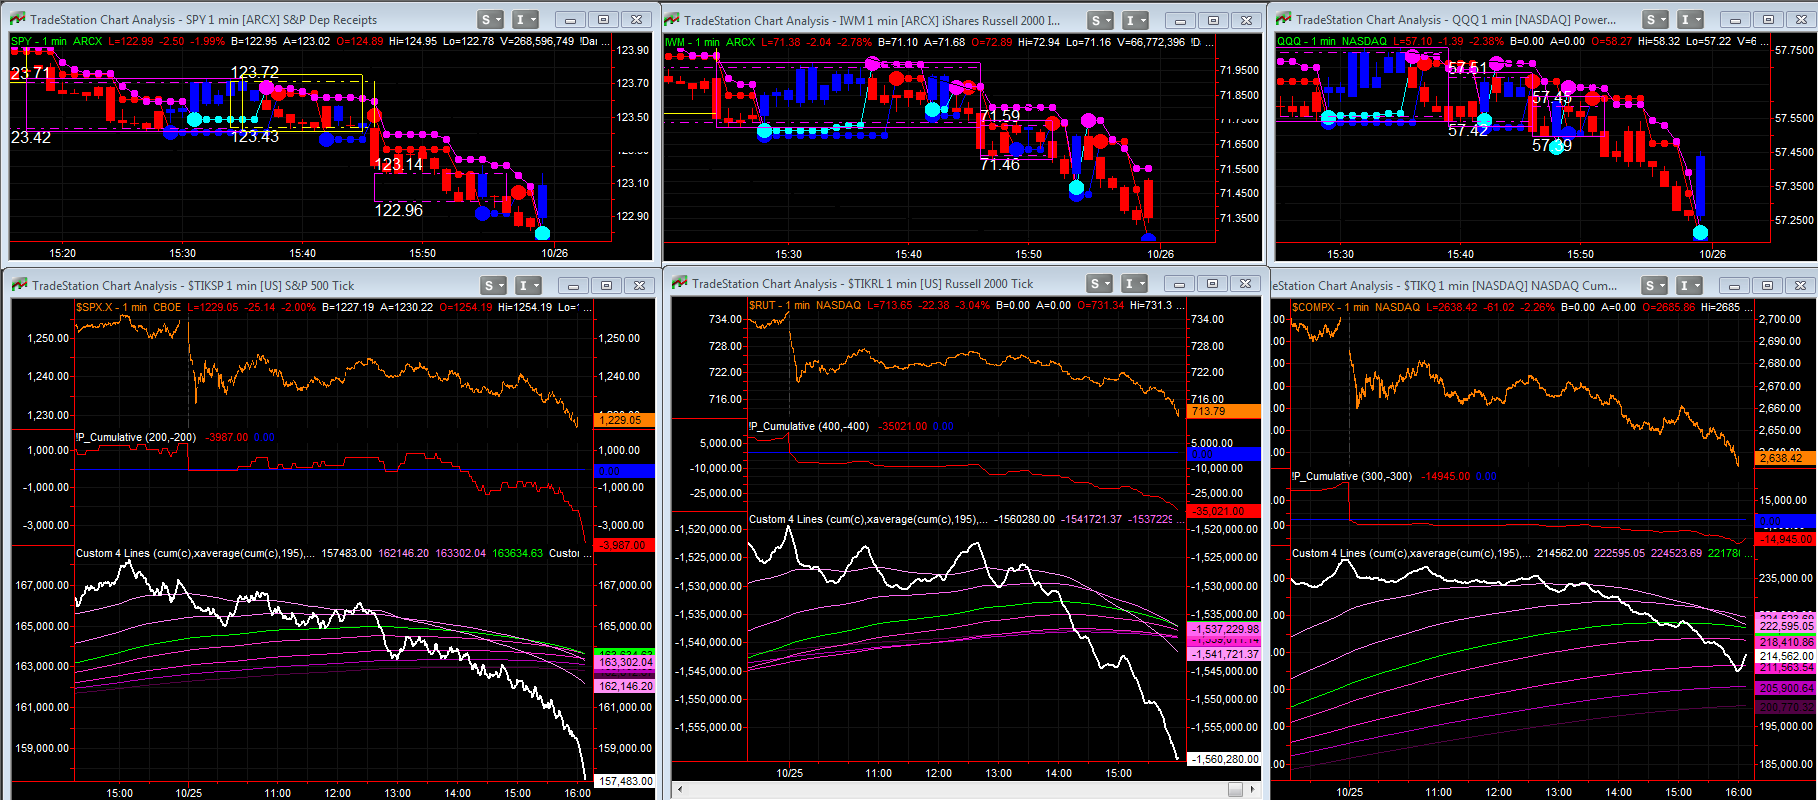
On the left we have the S&P500, in the middle the Russell 2K, and on the right the NASDAQ.
The sell-off due to the lack of an European agreement in front of tomorrow was deep on the S&P500 as well as the Russell 2K. The NDX held up better, but all three are obviously damaged. AMZN's miss after hours didn't help at all either.
My stance is guarded but more bullish than bearish. The fact that my automated TNA system got me out of the trades as the day got worse, but that the TZA system did not fire, tells me that we're at a crossroads. Futures are up marginally as I write this, so we'll see.
With respect to the Automated TICK system, details are just starting to materialize as I'm starting to get enough trades to see if this is going to work. While backtesting is important (yes, I owe a paper on this, I remember Bob), I think real money is important too. Here are the results of using TNA and TZA from October 1st, which is my official start date with this strategy:
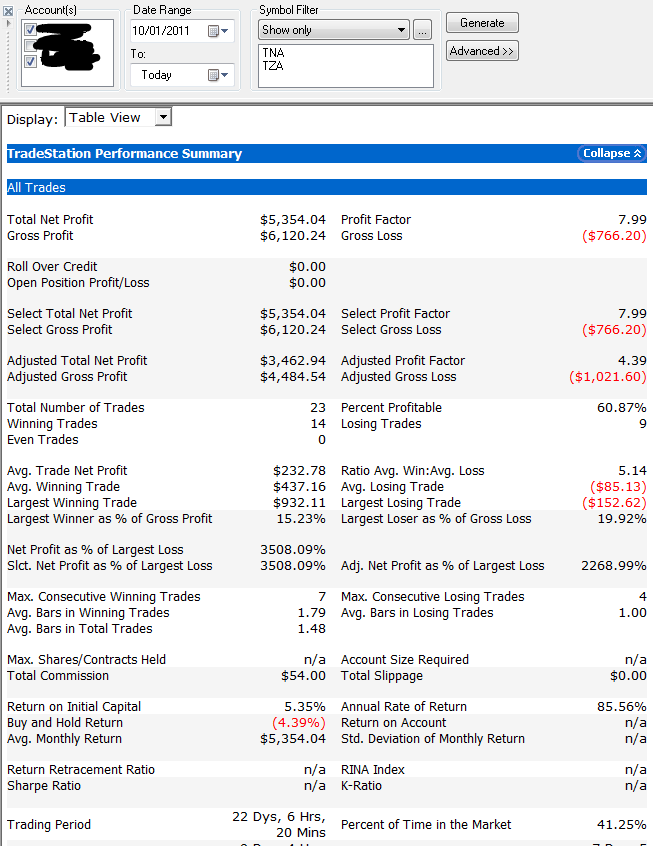
I'll continue to post weekly performance data as we march through time.
Note that this is work in progress, so please don't ask me to provide timely signals. I post only to show that there's something cooking which has promise. The issue here is that there is a SERIOUS disconnect between backtesting results and actual results (backtesting is far worse), so we've simply hit the system and conditions at a good time.
The results will get worse, not better -- THAT should be something you'd be willing to bet on !
Regards,
pgd
-
Hi Paul,
Thank you for this update! I have been paper trading a model based on $tick - though I am sure not as sophisticated as yours. It still needs significant backtesting though. I look forward to your continued posts on this subject and your paper.
Harry
-
Thanks, Paul. One thing I've empirically noticed in this up leg is the cume Ticks have been getting whipsawed more by their MAs (I only watch Billy's). From the August low to the most recent low, simply trading the cross of the 10 hour was very profitable. Keep plugging away!
 Posting Permissions
- You may not post new threads
- You may not post replies
- You may not post attachments
- You may not edit your posts
Forum Rules


 Reply With Quote