-
Update for Friday, October 7th
There is an interesting divergence setting up and in looking back through a year's data, I can't find a close duplicate, so time to watch it unfold.
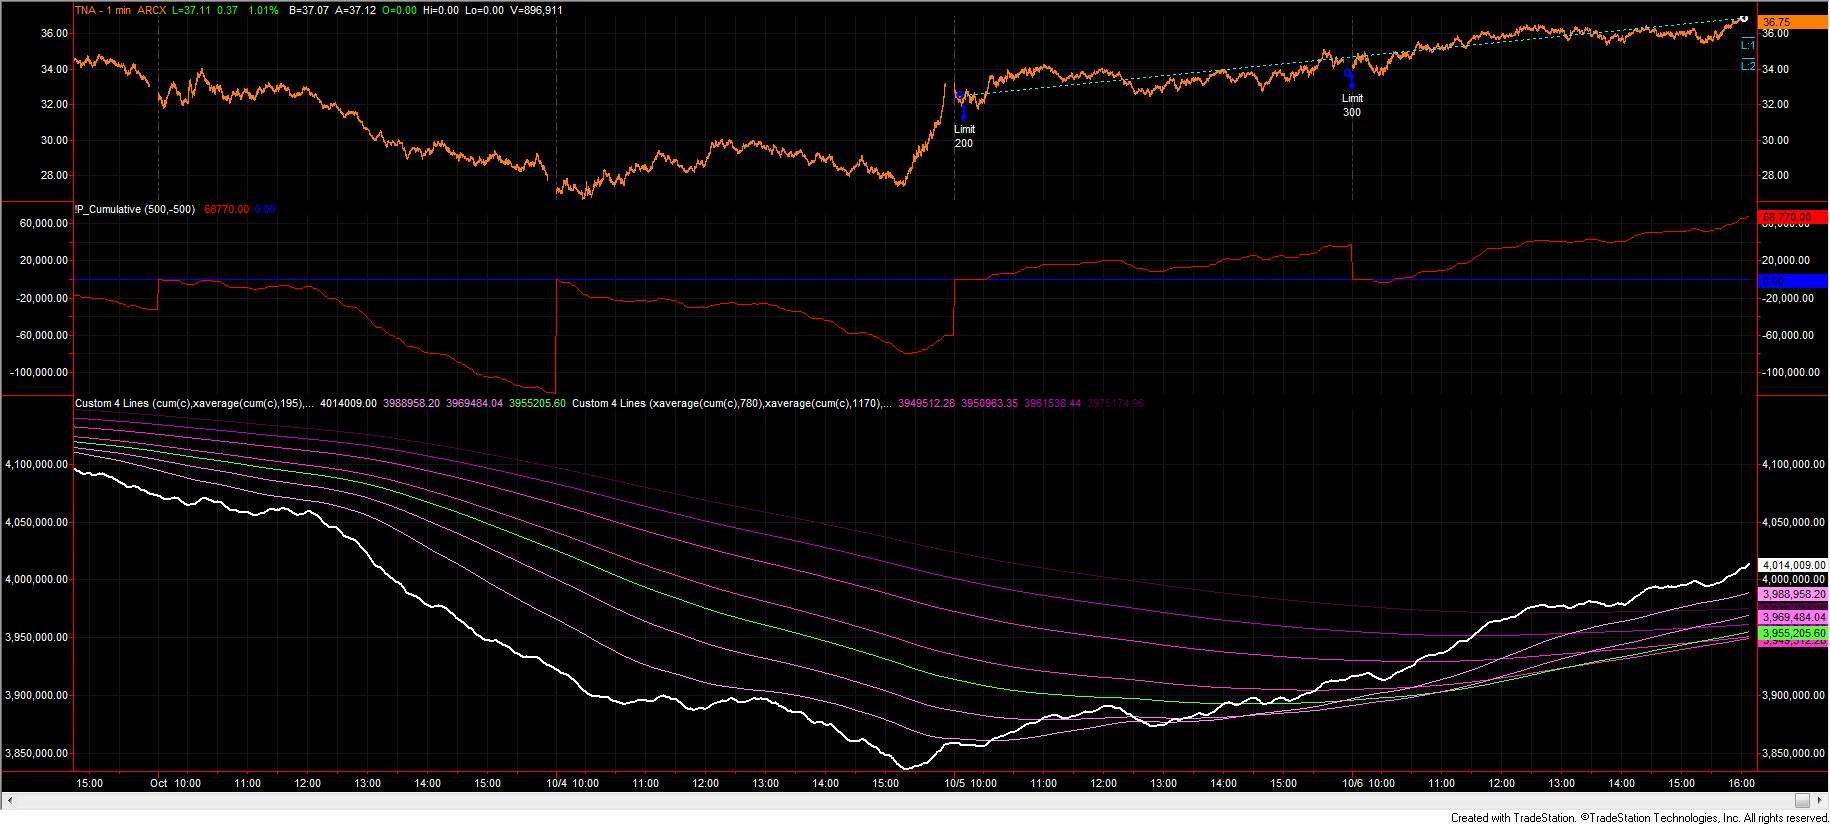
Primarily, the $TICK indicator is strong:
As with all my images, right click to open in a new tab or window.
The cumulative tick pattern on the bottom is showing the "bullish rollover" that a ribbon band gives -- the instantaneous cume tick is in white, and the moving averages are in various shades of light purple (shortest) to dark purple (longest). The green line is the 10h MA line.
Immediately evident is that the first "breech" of the previous down leg occurred when the cume tick crossed the 1/2d MA from below around 10 a.m. on 10/5. It had not done this in several days, so this was an initial confirmation that the previous trend was in jeopardy.
The second head's up was the crossing of the 1d MA from below which occurred around 11 a.m. on 10/5. Note that both the 1/2d and 1d slopes had started to point positive shortly thereafter, and if the previous end-of-day-reversal didn't close your short positions, some backtesting that I've done with this "failsafe" slope method suggests that these two limit the downside damage if you miss an exit. These are not good exits by themselves, but they do help.
We all were challenged when the cume tick line reversed and headed down -- the aforementioned slopes also reversed which is why these are not a great exit indicator by themselves.
Finally, around 14:00 on 10/5 the cume tick line crossed the 10d MA from below, tested it a few times shortly thereafter, and then it's been off to the races since.
Of all the tests I've done all week, signals based on the cume tick line are the most robust compared to $TIKSP, $TIKRL, and $TIKQ or $TIKND. Hence, you'll see me using this more going forward (thanks Billy!).
=====
The aforementioned divergence is present in the $TIKSP (S&P500) and $TIKRL (Russell 2K small caps):
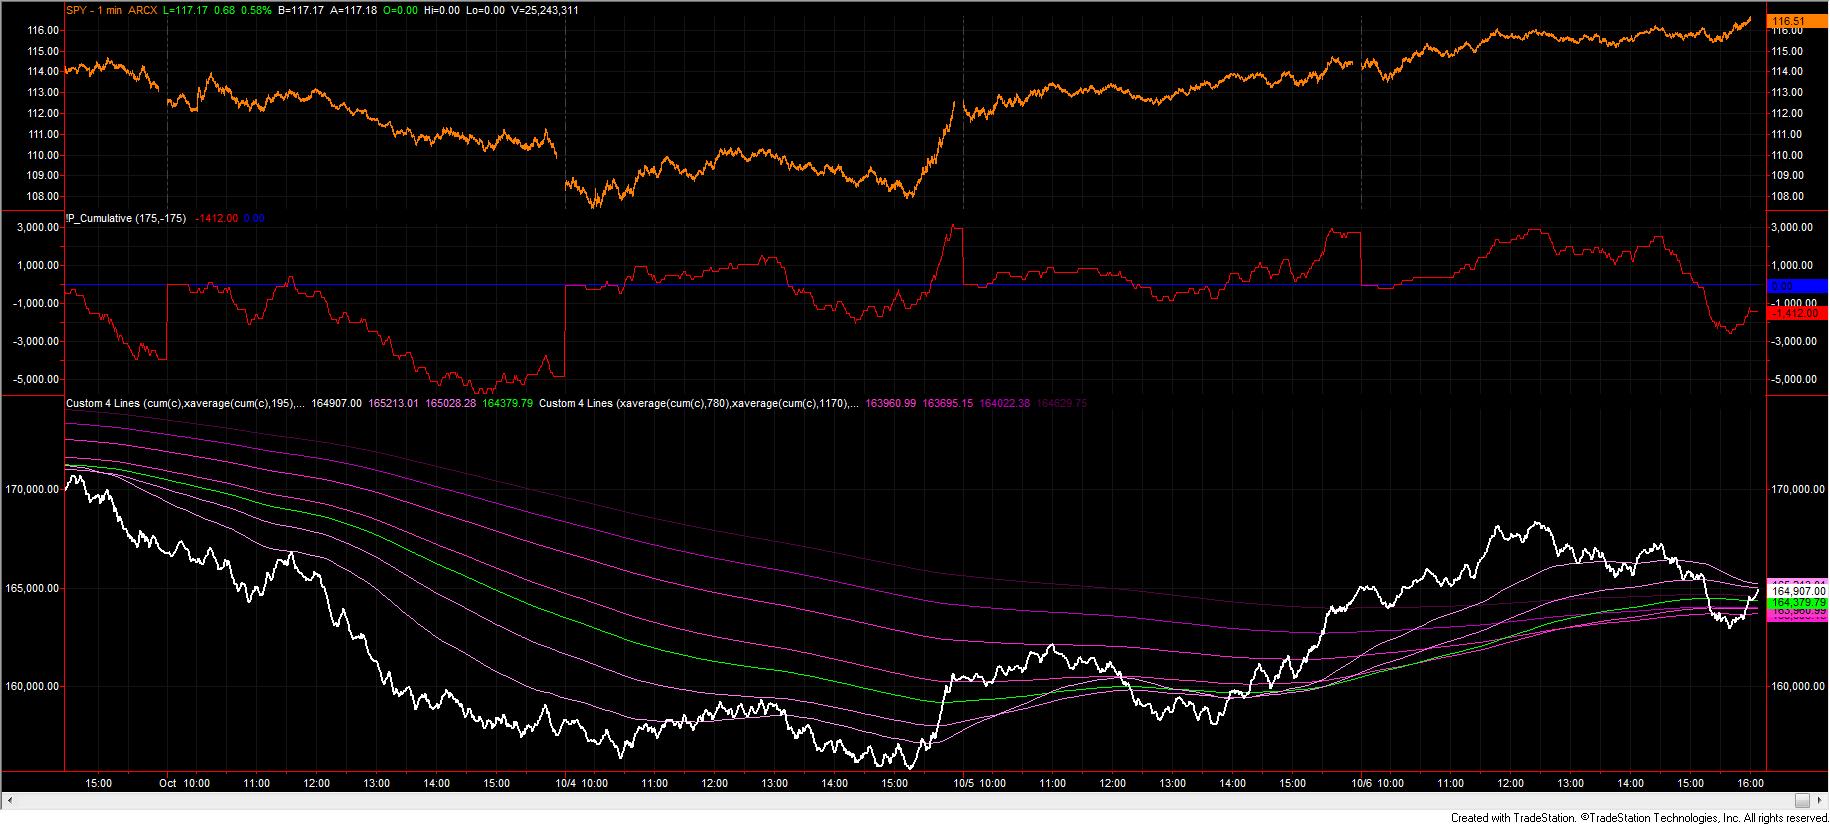
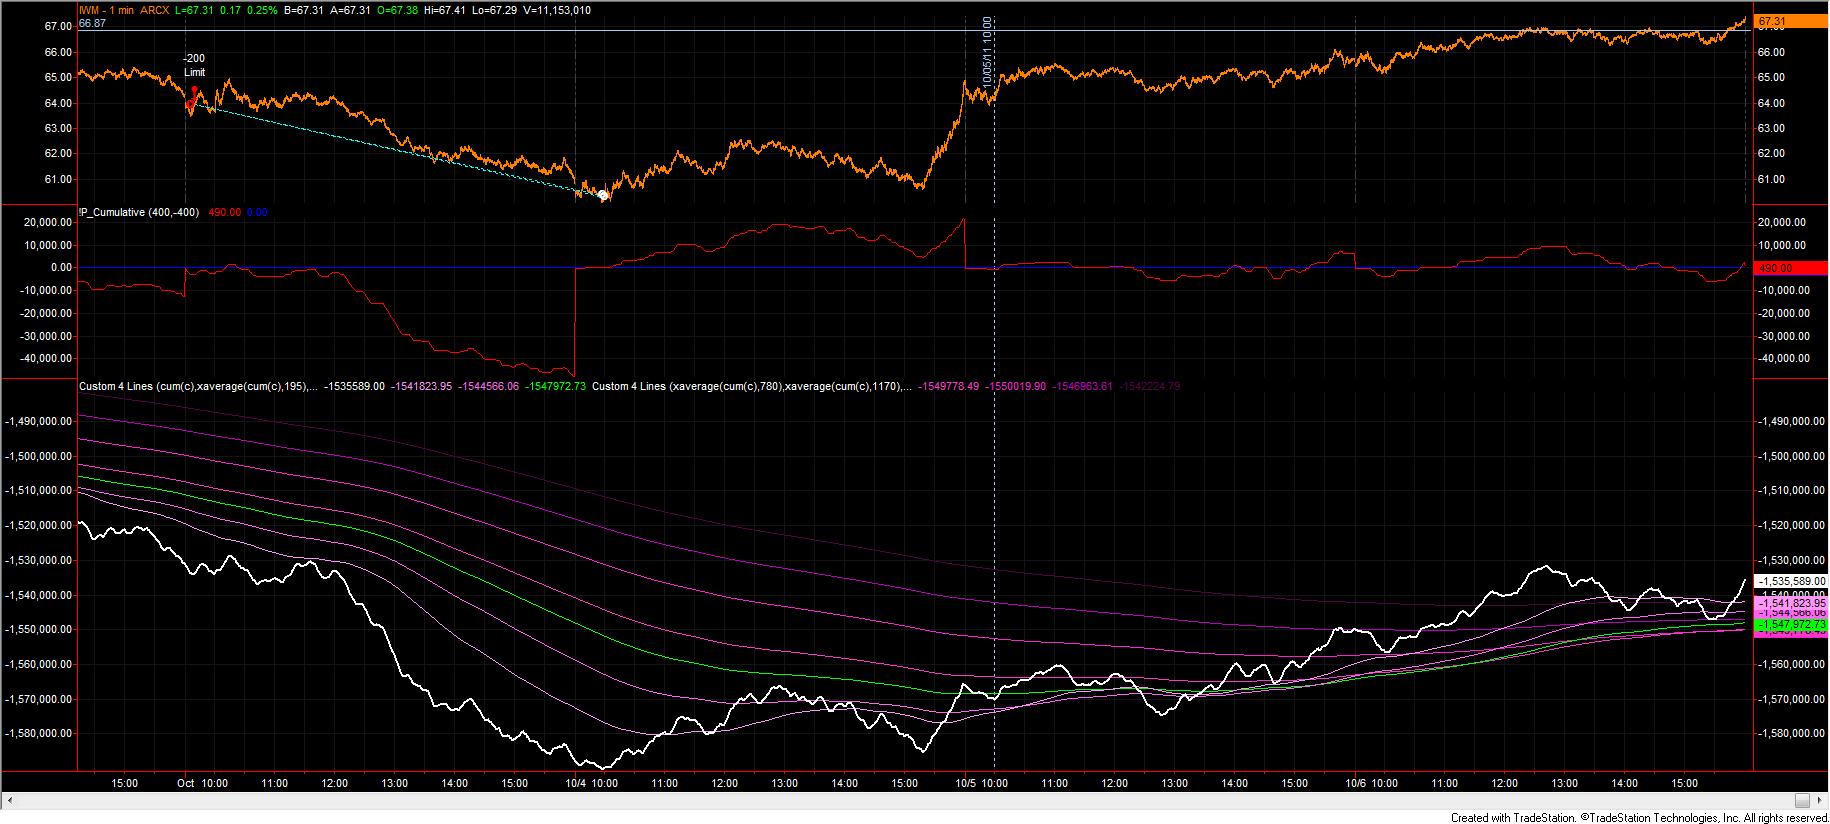
The SPX is on top and the R2K is on the bottom.
Note how the price of the SPX was steady or moving upward and it's cume $TIKSP pattern was dropping, causing the majority of the cume MAs to reverse too. Also note in the middle of the SPX pane the intra-day filter on the SPX showed clear selling pressure starting like clockwork at 14:30 EDT and price held relatively steady. I don't like steady prices on selling pressure -- this is churning -- and it shows great indecision.
The bottom figure is the Russell 2K and while we're clearly above the 10h MA (green), we seemed to have stabilized around noon and then experienced a slow drift down in selling pressure while prices remained more-or-less constant. This reversed around 15:30 pm, but it didn't give me the greatest confidence about the internals yesterday afternoon.
Consequently, I took 2/3 of my profits off the table at the end of the day, and while I'm glad I left 1/3 on the table, as I write this (10:15 am on 10/7), we're not moving much.
I'm keeping my eye on the ball to see if we stall here or inch higher. There's no reason to sell to lock profits, but I've not seen any compelling reason to enter new long positions either.
===============
Regards,
pgd
Last edited by grems8544; 10-07-2011 at 10:18 AM.
Reason: typo ...
 Posting Permissions
- You may not post new threads
- You may not post replies
- You may not post attachments
- You may not edit your posts
Forum Rules


 Reply With Quote